📚 Comic Archive
Catch up on your favorite data dramas!
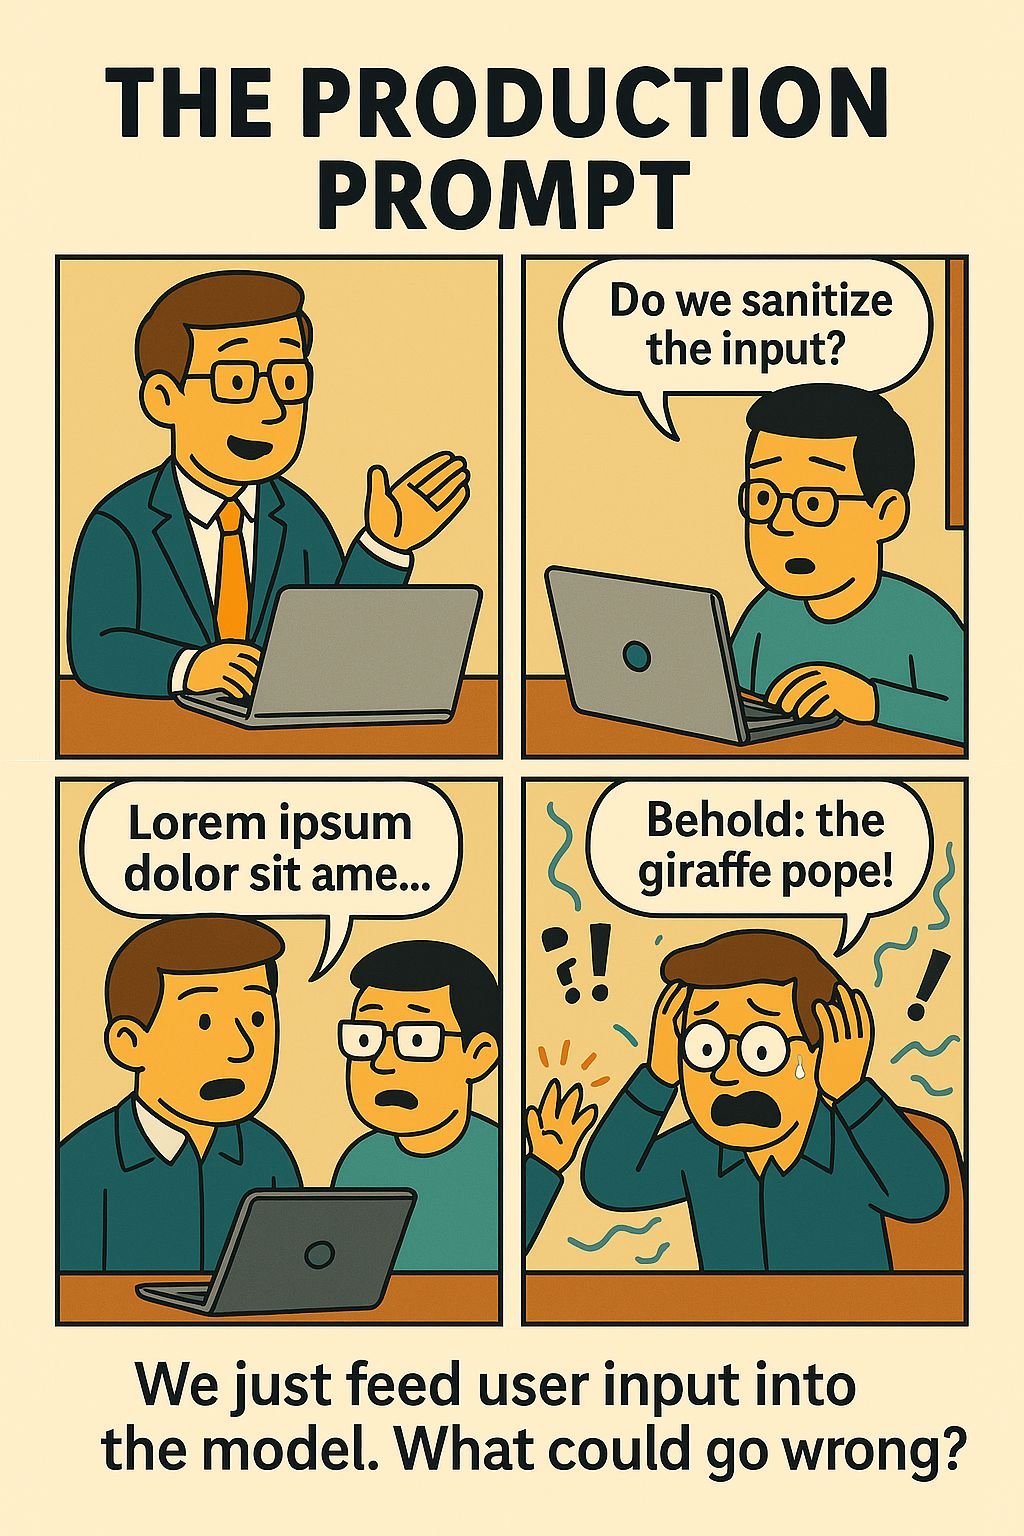
The Production Prompt
PM: “The model’s smart.”
Dev: “Do we sanitize input?”
Live demo: gibberish, hallucinations, horror.
Oops. 🧠🔥🧼
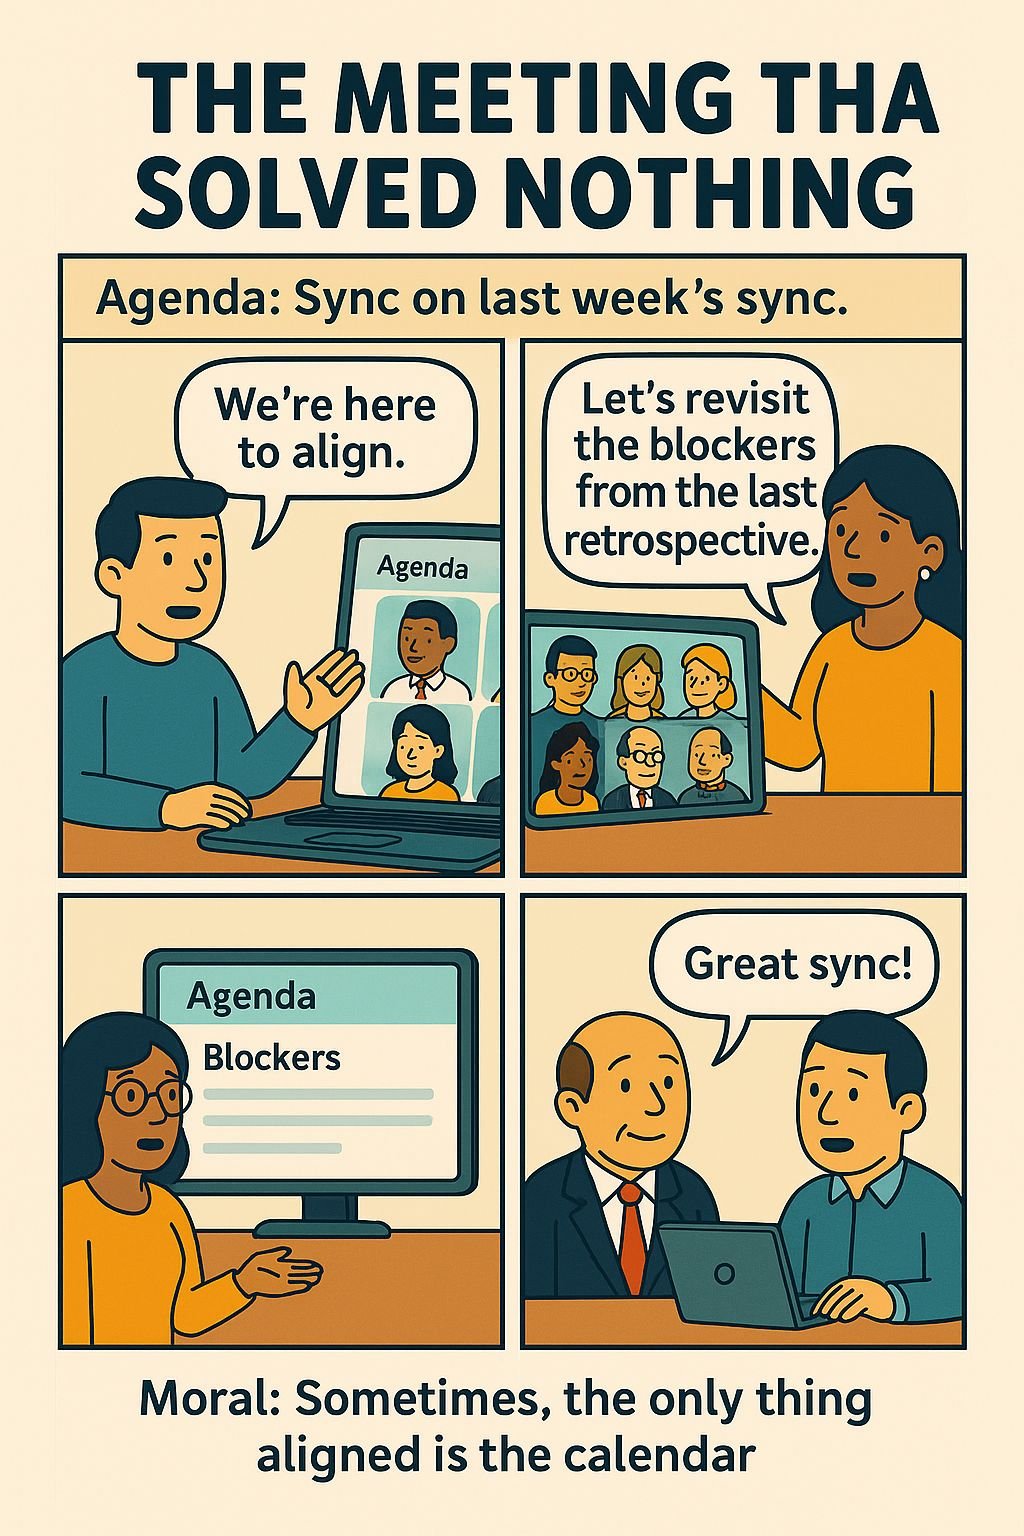
The Meeting That Solved Nothing
“We’re here to align.”
“Let’s revisit blockers.”
One hour later, same deck.
Conclusion? “Great sync!” 🧑💻📆🙃
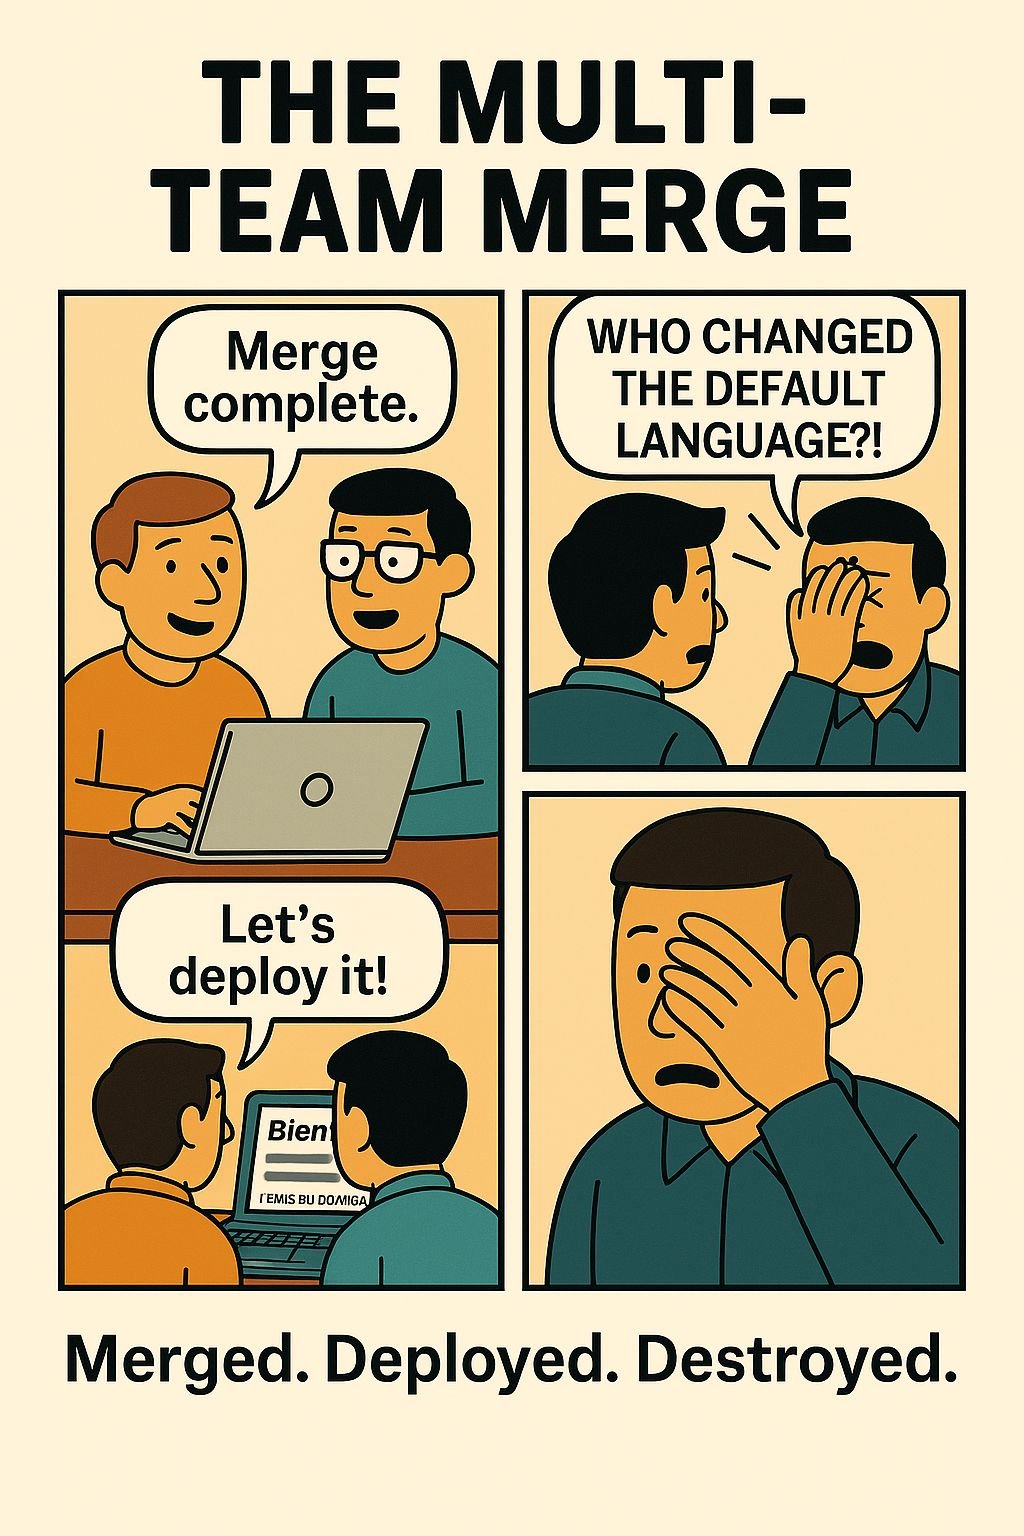
The Multi-Team Merge
Dev A: “All merged!”
Dev B: “Deploy!”
Users: “Why is my UI in French?”
Git: “It merged. Not synced.” 🌍💥🧩
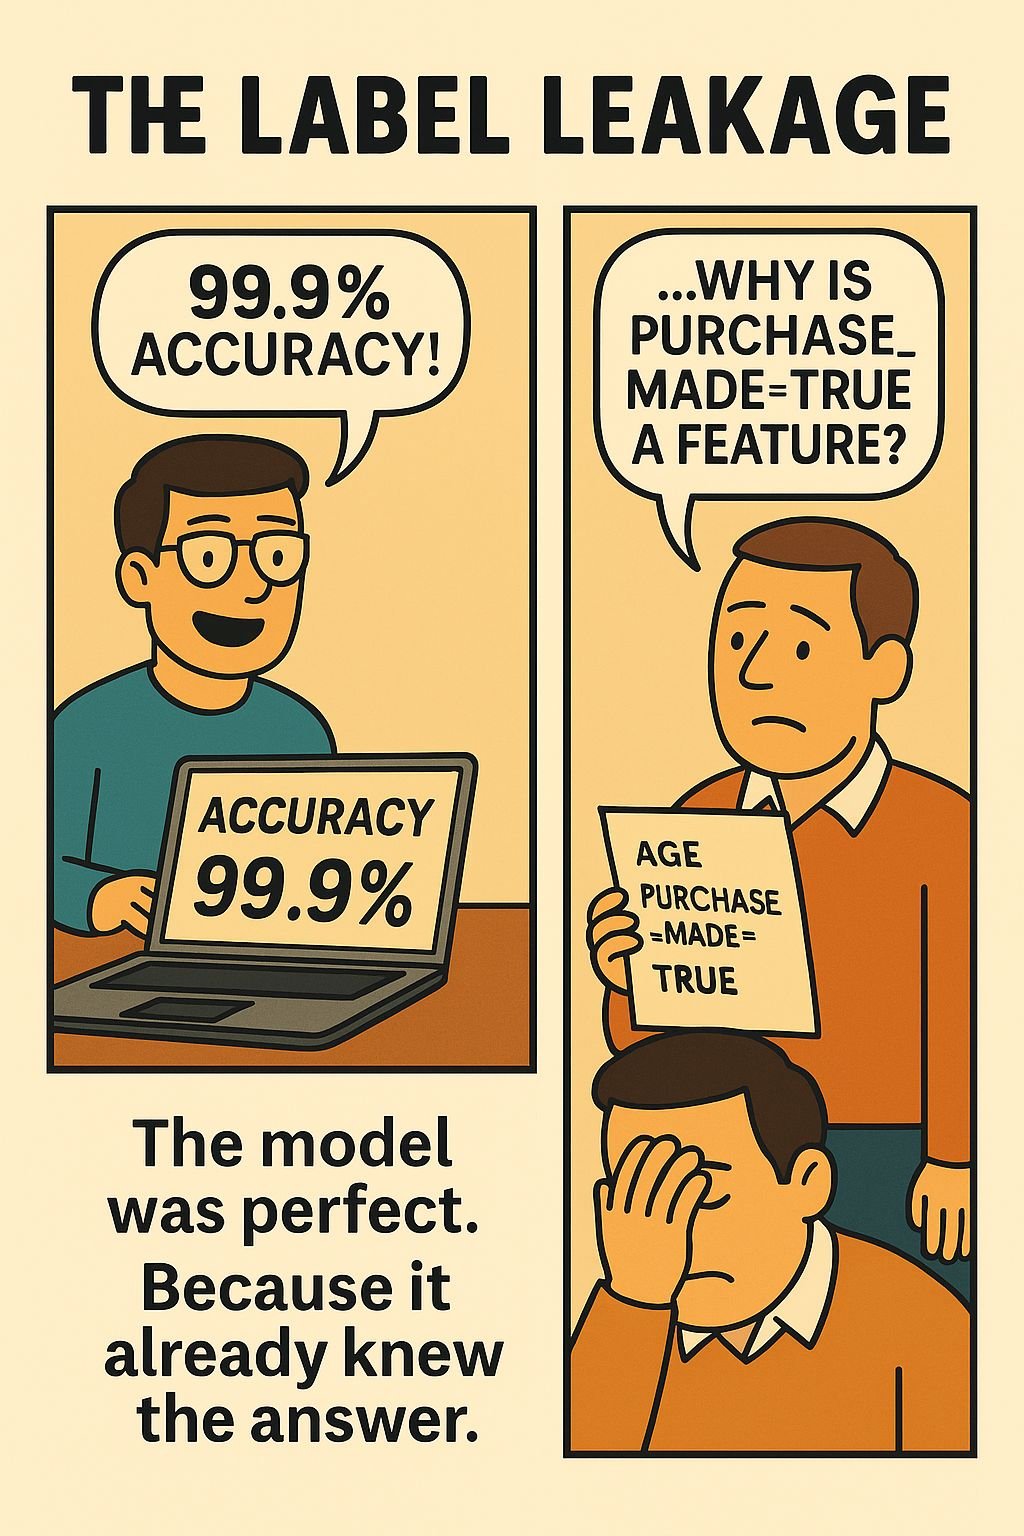
The Label Leakage
Engineer: “99.9% accuracy!”
Peer: “Why’s purchase_made in features?”
Silence. Realization. Facepalm. It leaked — and so did trust. 🤖💔📉

Stuck in Staging
Dev: “It works in staging!”
PM: “Cool. When can we see it in prod?”
Whispers: “Never.” Staging is where hopes go to retire. ⚙️🕳️😬
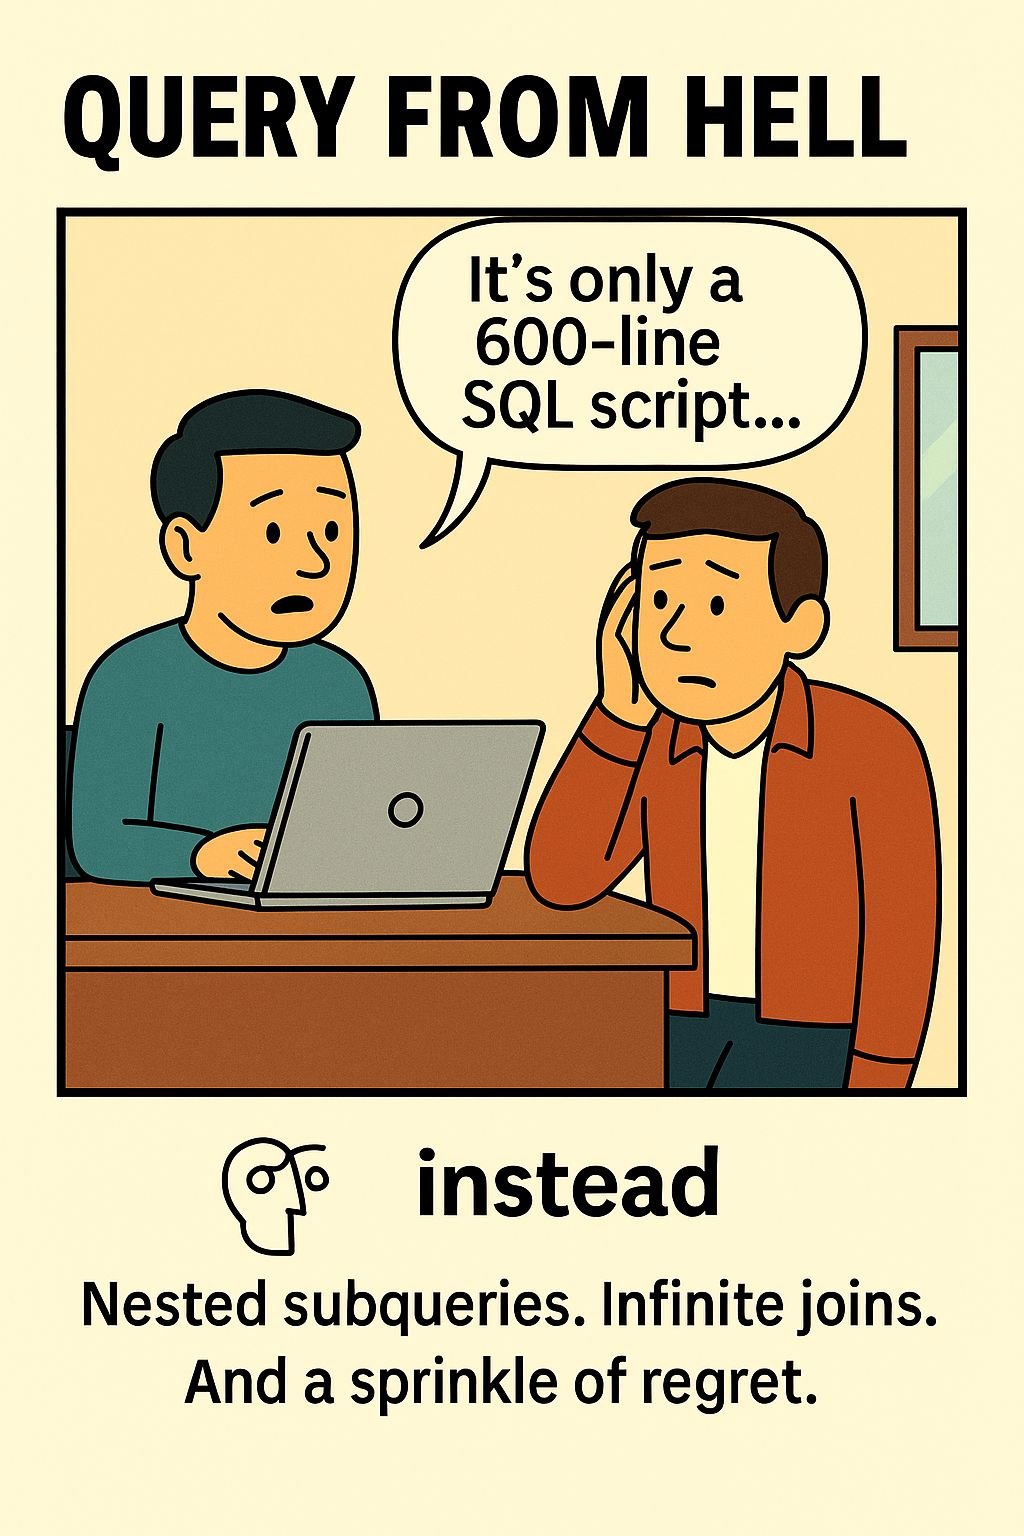
Query from Hell
Engineer: “It’s only a 600-line SQL script…”
Colleague: “Who hurt you?”
Nested subqueries. Infinite joins. A sprinkle of regret. 🔥💾🤯
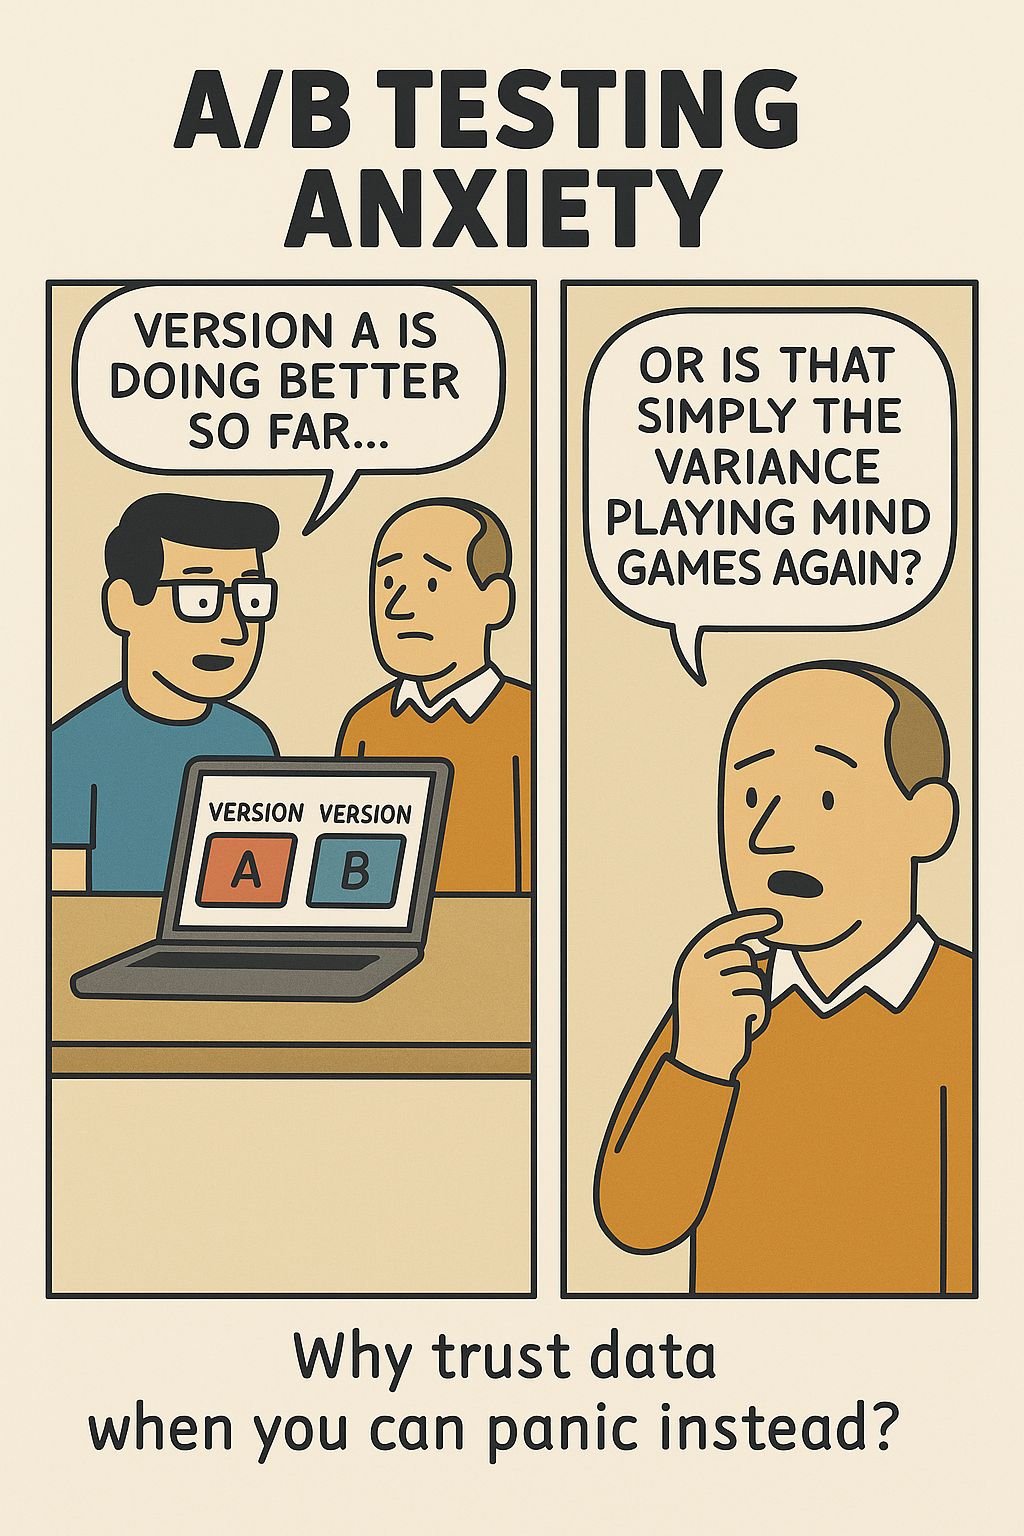
A/B Testing Anxiety
PM: “Which version performed better?”
Analyst: “A was worse than B. But B was worse than A…”
Confidence intervals. More like confidence issues. 😵
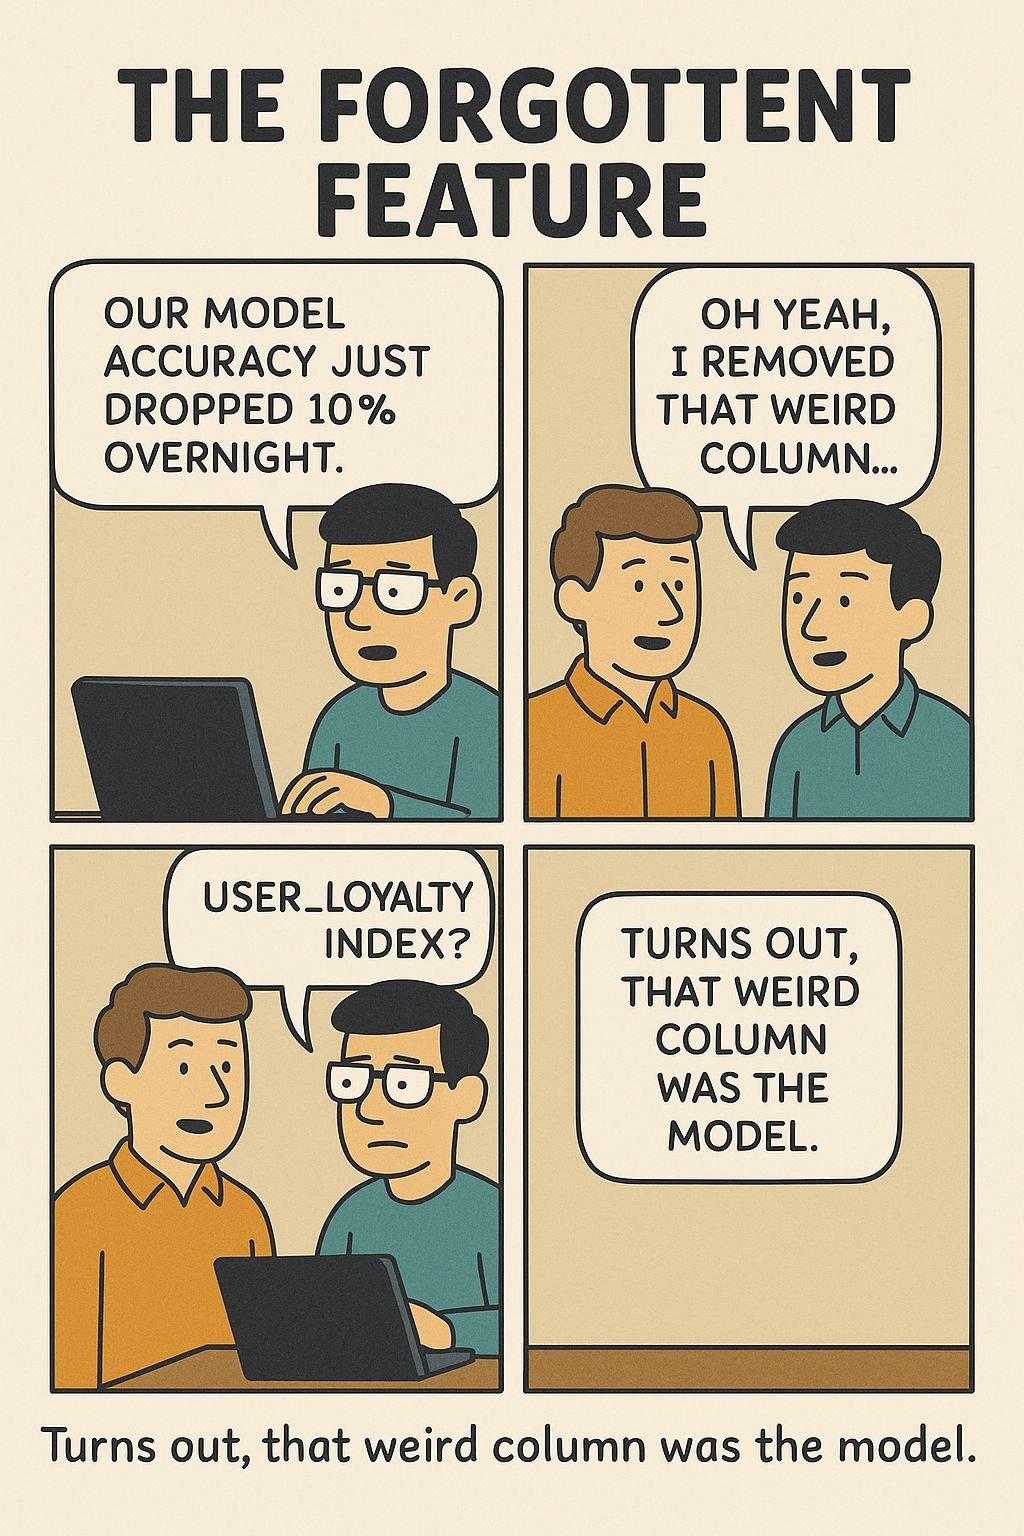
The Forgotten Feature
Data Scientist: “Model accuracy dropped 10% overnight.”
Dev: “Oh… I removed user_loyalty_index.”
Turns out, that *was* the model.💥
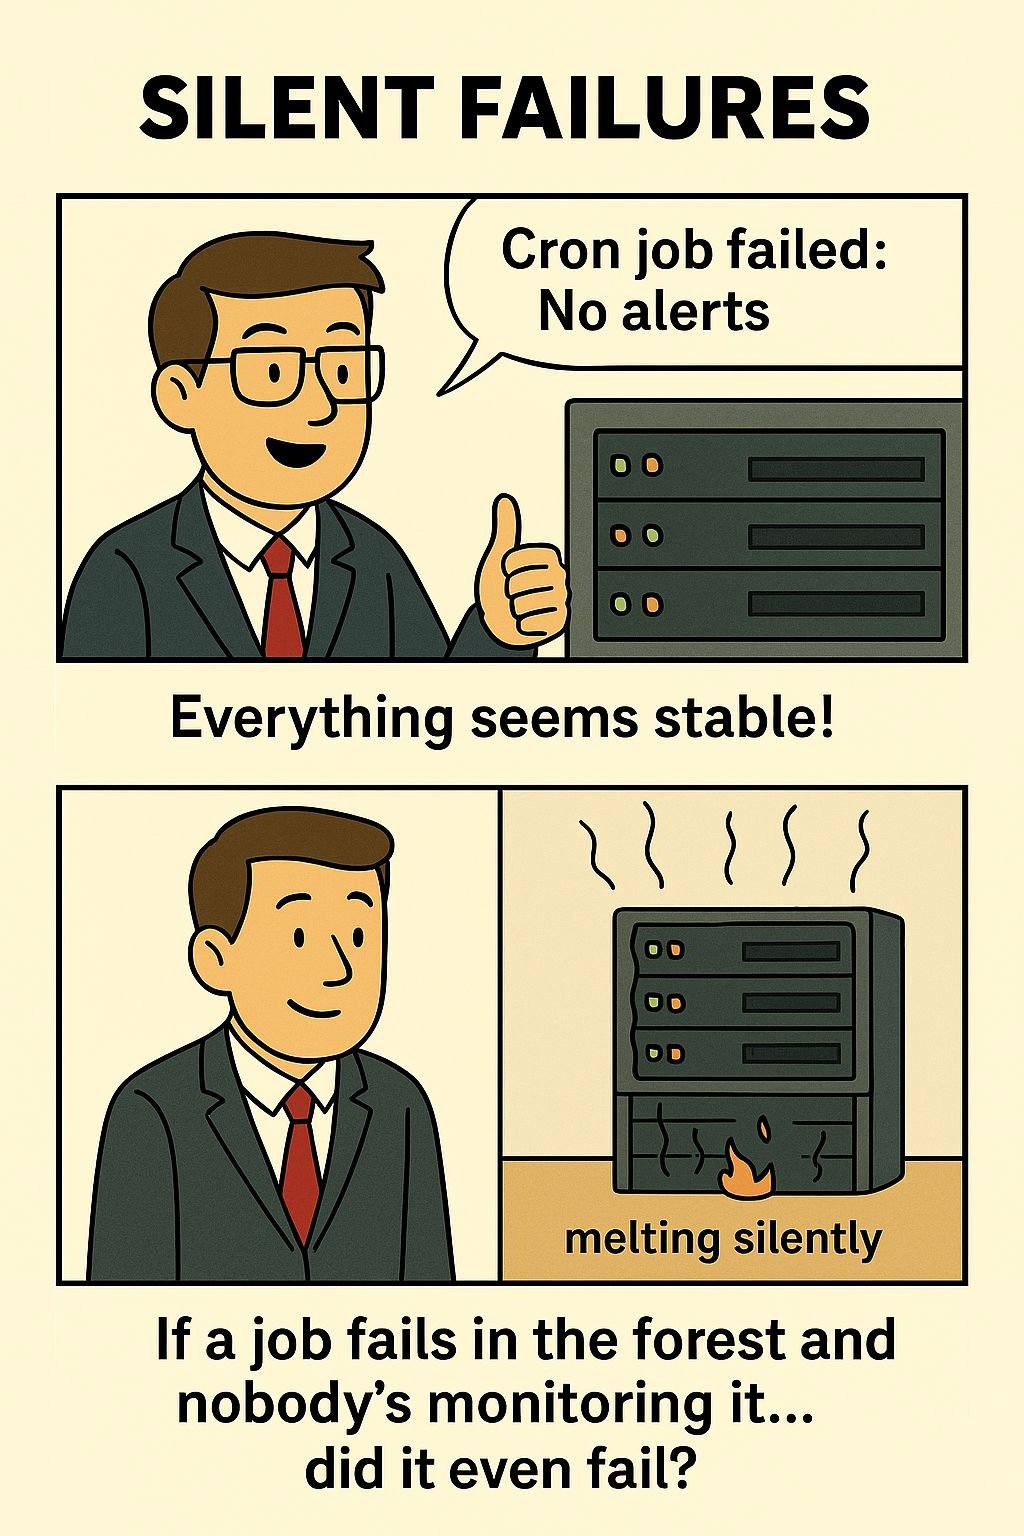
Silent Failures
Cron job failed. No alerts. No logs. No clue.
Team Lead: “Everything seems stable!”
Meanwhile, systems melt in silence. 🔥
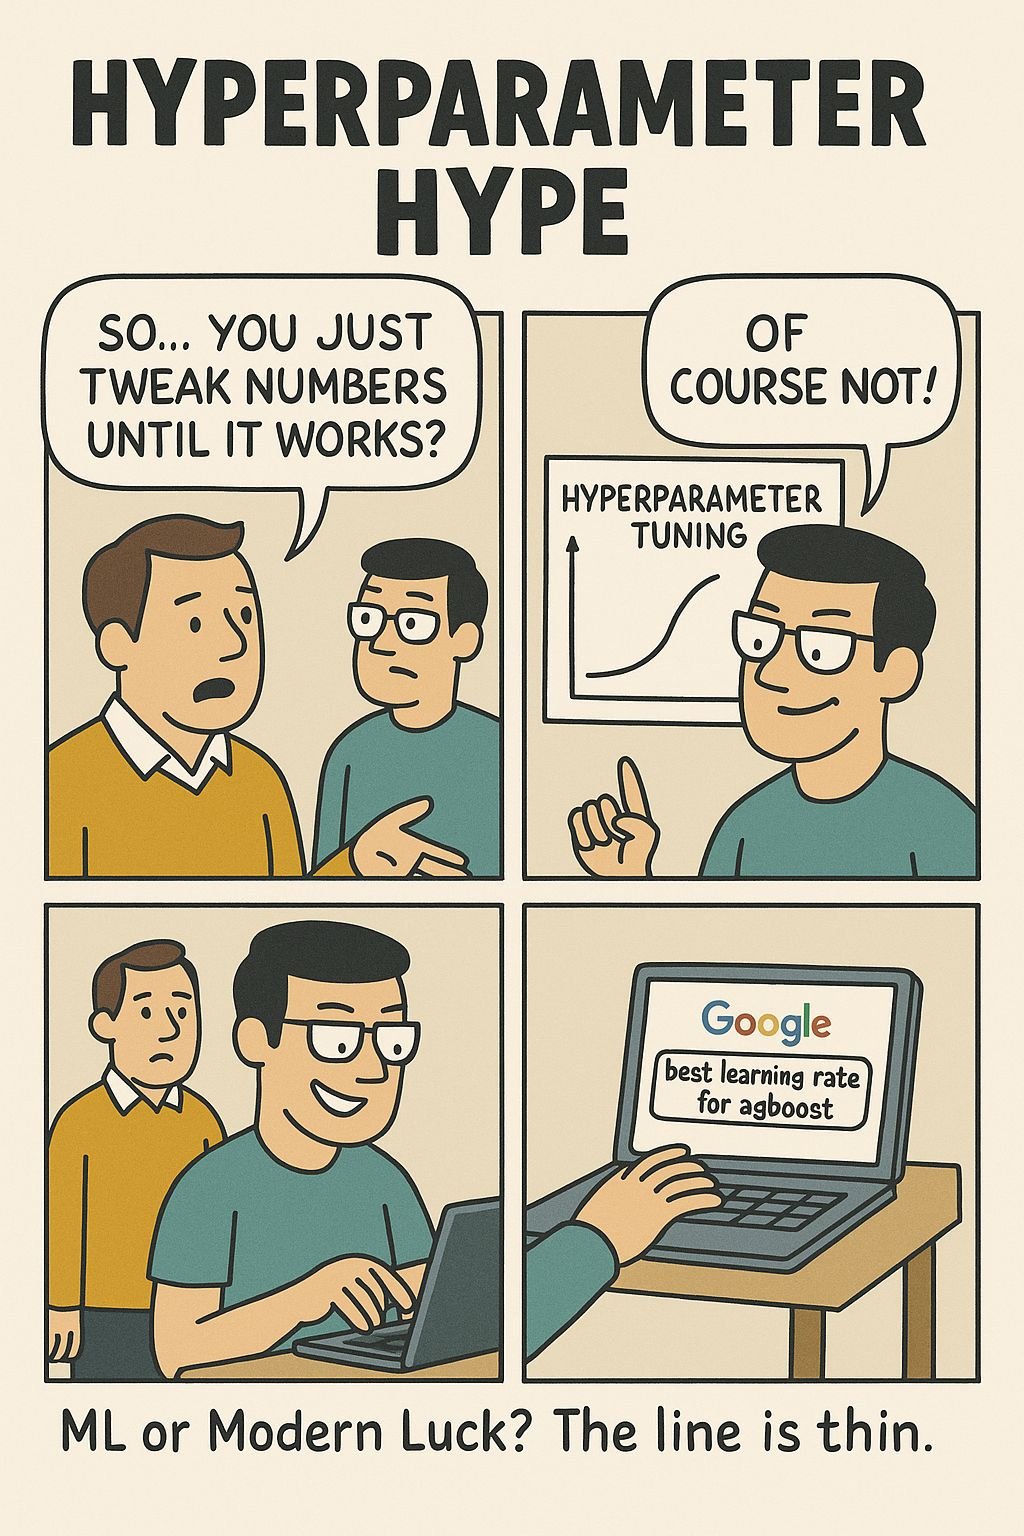
Hyperparameter Hype
Manager: “So… you tweak numbers?”
Data Scientist: “No, we Google which numbers to tweak.”
ML or modern luck? You decide. 🎯
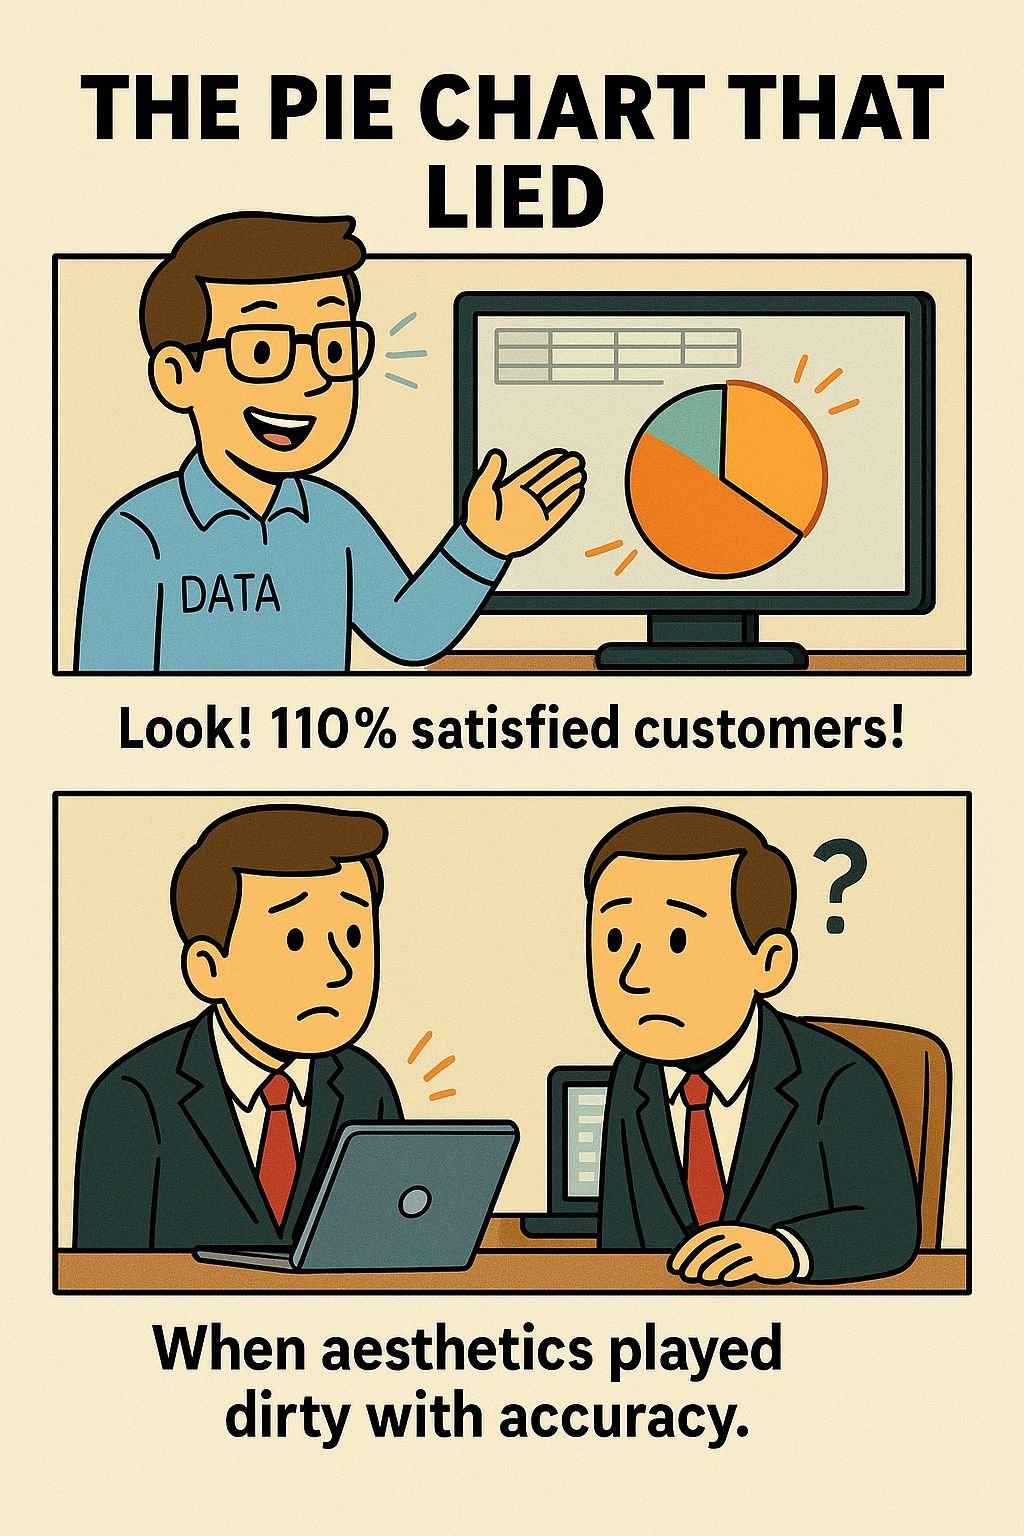
The Pie Chart That Lied
Three segments. Each labeled 33%.
Total? 110%. Accuracy is a suggestion, aesthetics the goal. 📊🍕
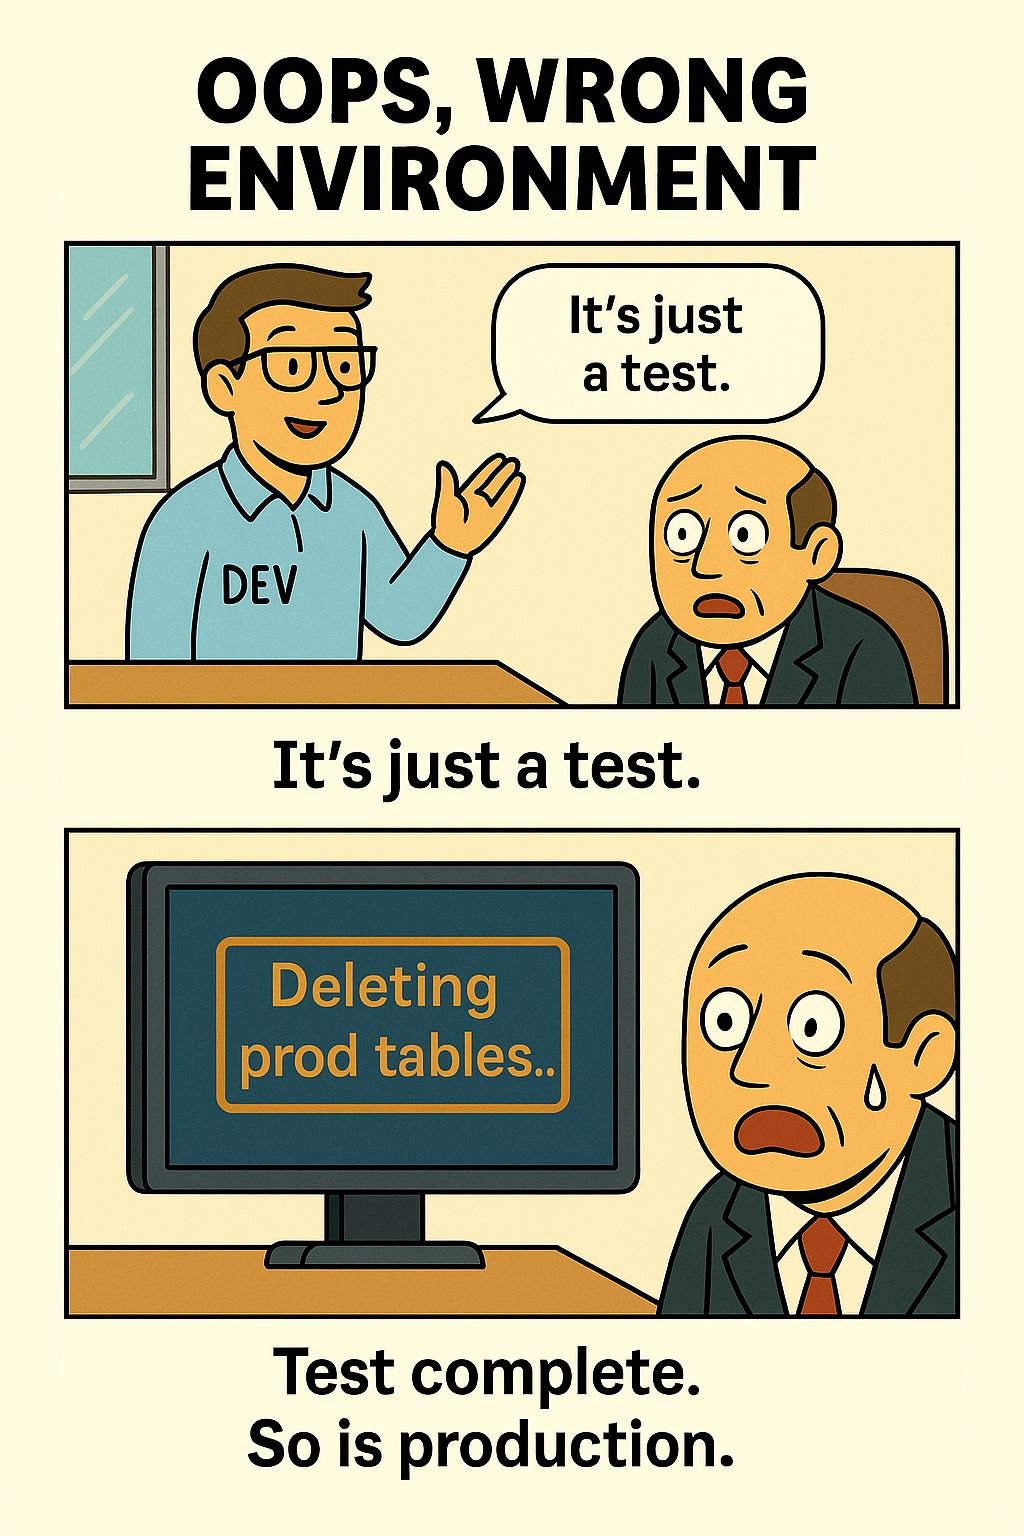
Oops, Wrong Environment
Dev: “It’s just a test.”
Script: *deletes prod tables*
Test complete. So is production. ⚠️🧨

Version Control Chaos
File: final_v12_latest_REAL_final.py 🙃 The only true source of truth is chaos.
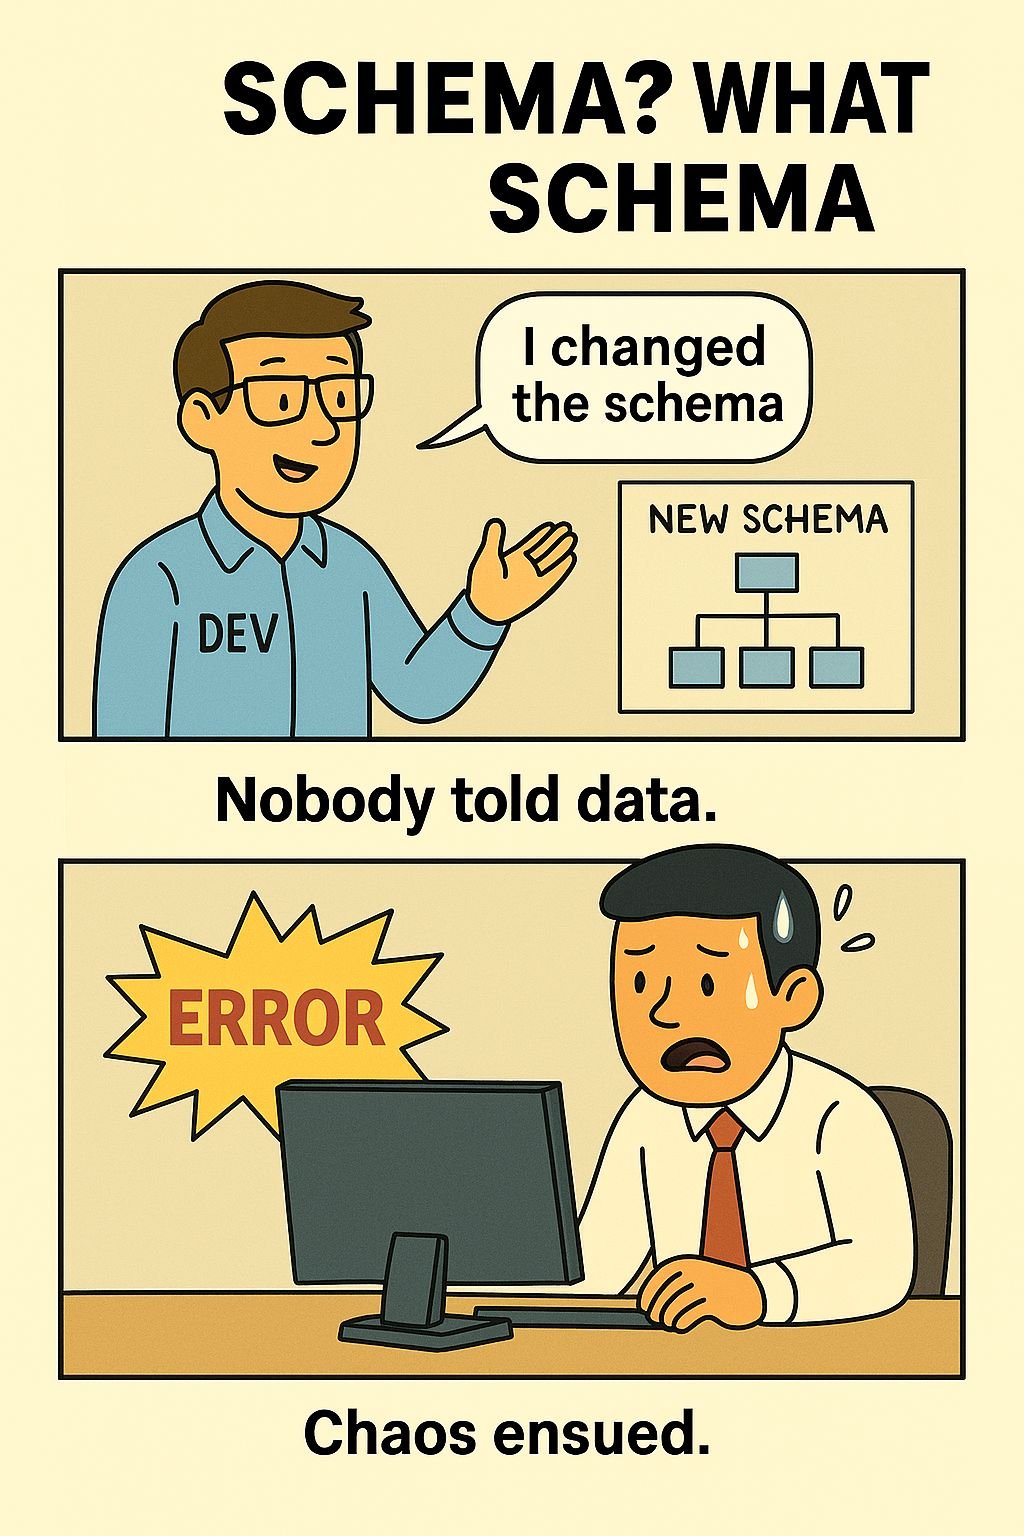
Schema? What Schema?
Dev changed the schema. Nobody told the data team. Chaos ensued. 🧨
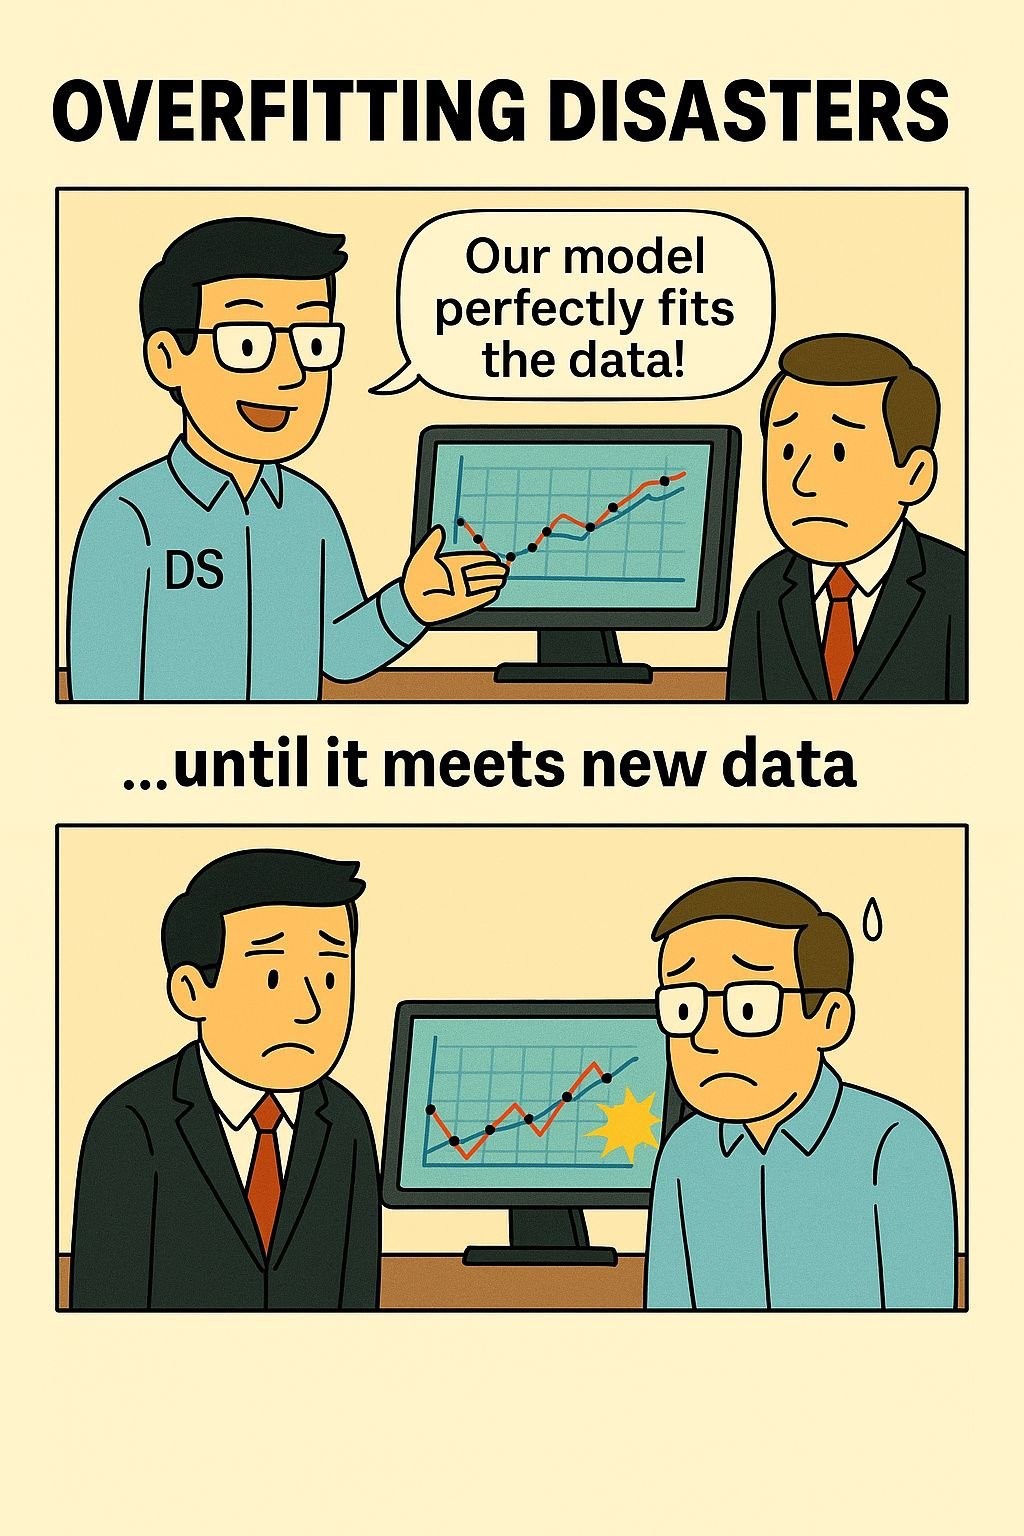
Overfitting Disasters
Model accuracy: 100%. Real-world accuracy: oops. When overfitting strikes. 🎯
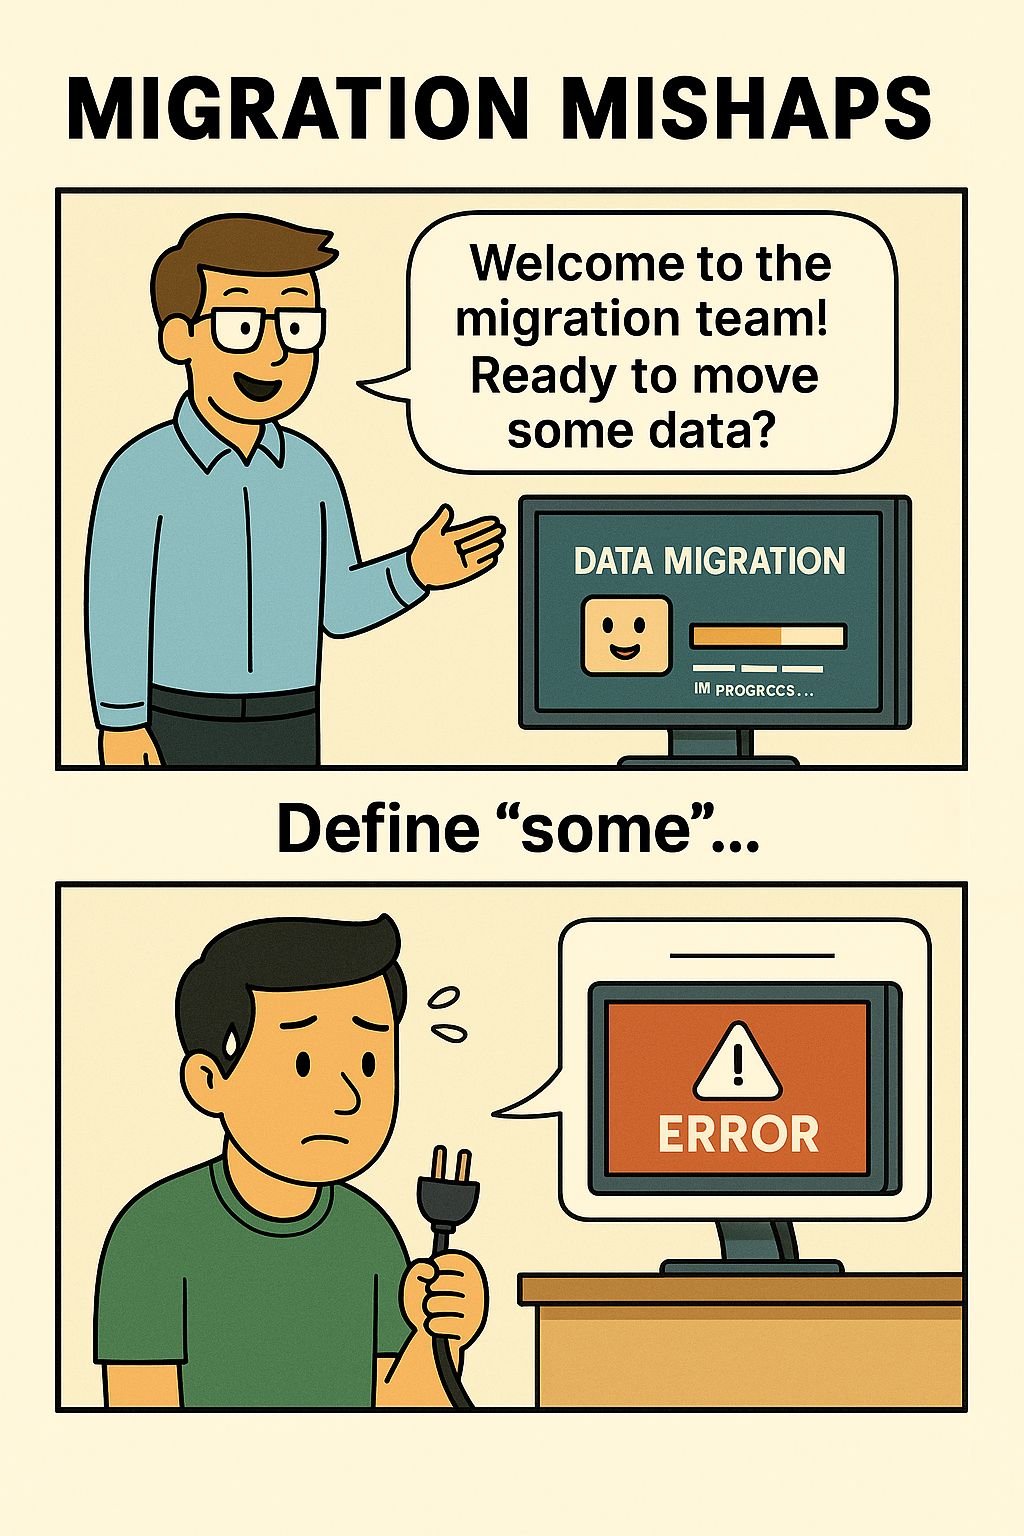
Migration Mishaps
“We migrated everything!” – “Why are all totals in Cyrillic?” UTF-8 says hi. 🌀

The Legend of Production Data
“Can I test this in prod?” – said no senior analyst ever. 🧨
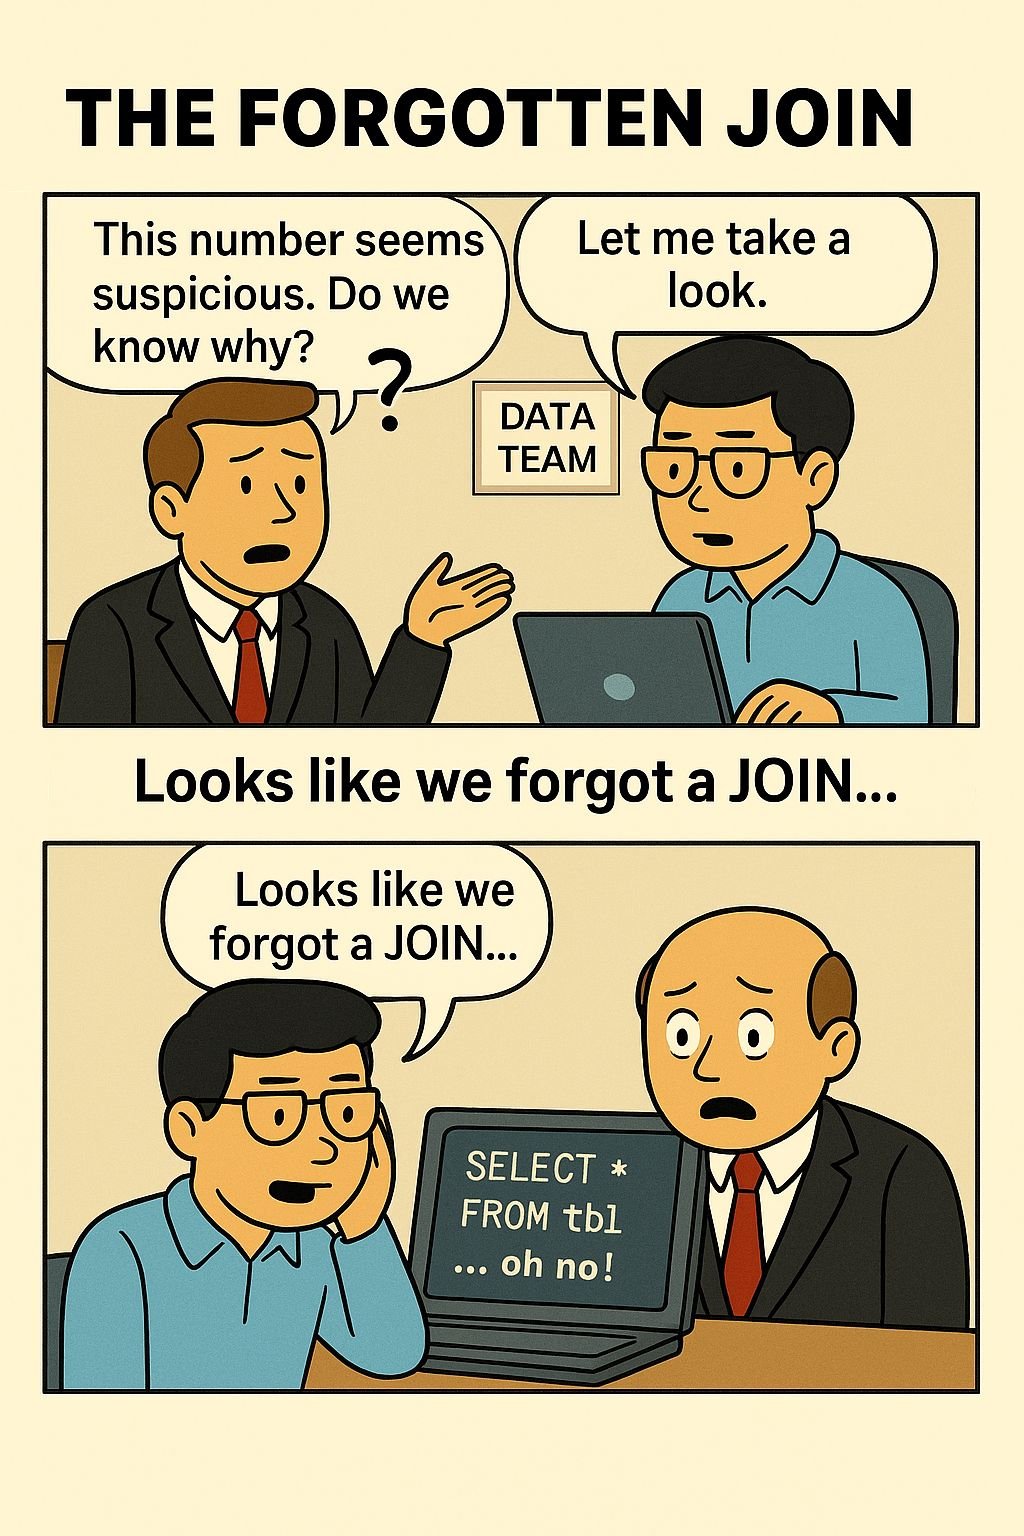
The Forgotten JOIN
17 million users? That’s what happens when someone forgets the JOIN condition. 💥
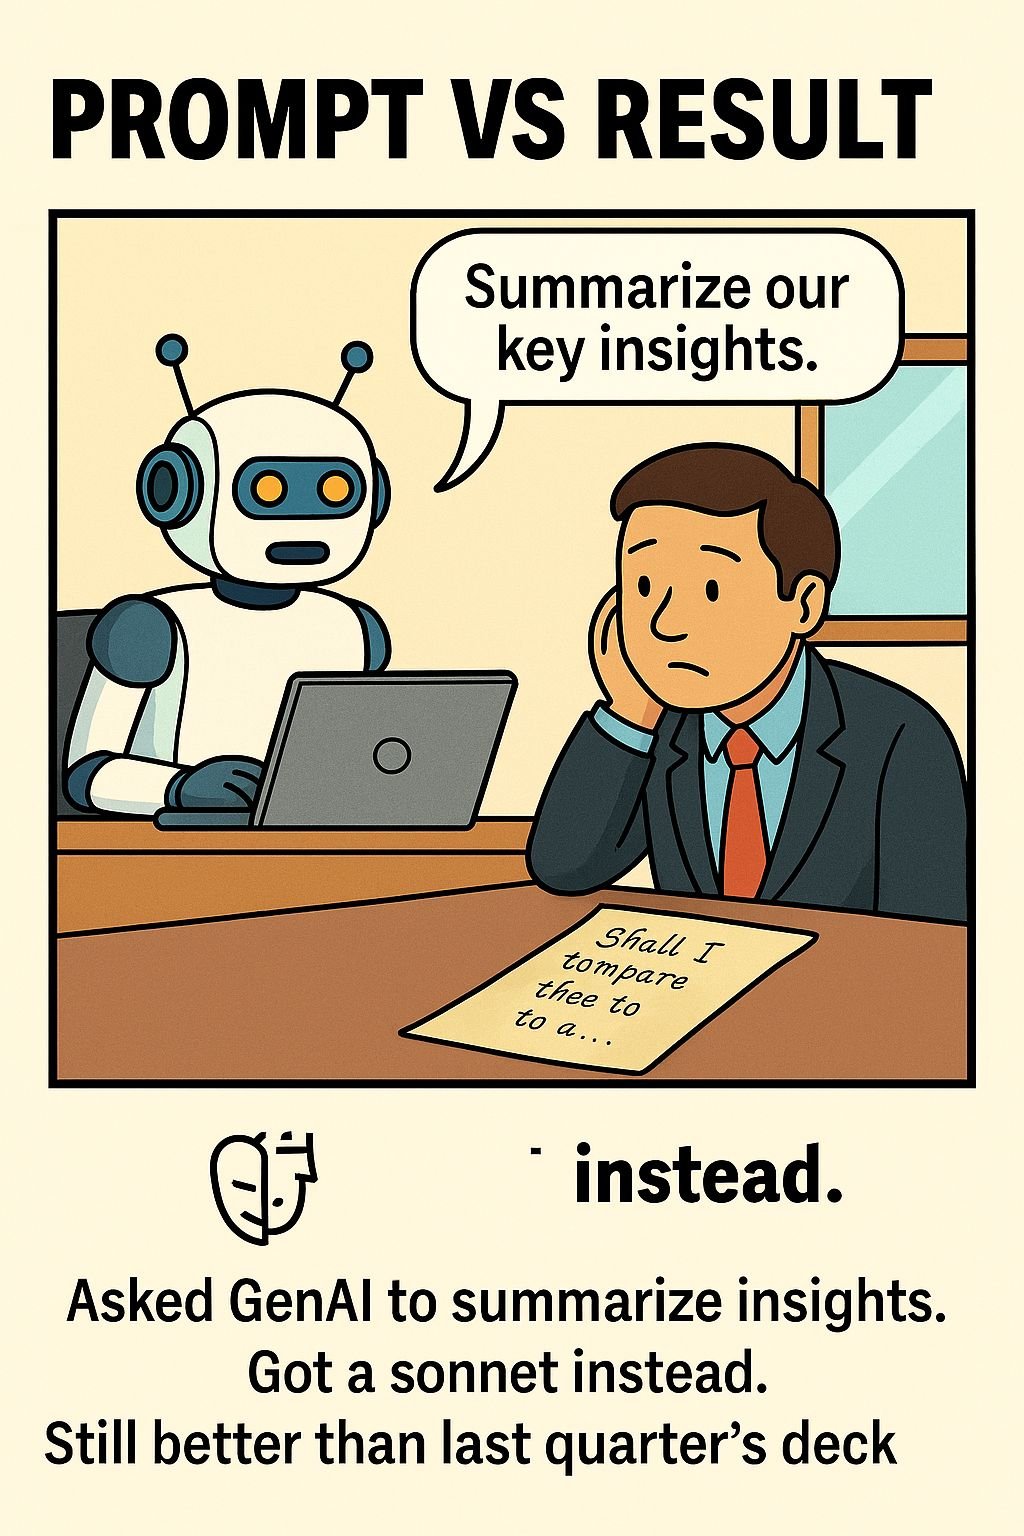
Prompt vs Result
Prompted GenAI for a data summary.
It wrote a Shakespearean sonnet. Still better than last quarter’s report. 🎭📊

Churn in Peace
Client: “Can we predict churn?”
Data Team: “Only if you give us behavior data.”
Client: “We’ve got names and numbers.” 🤷♂️
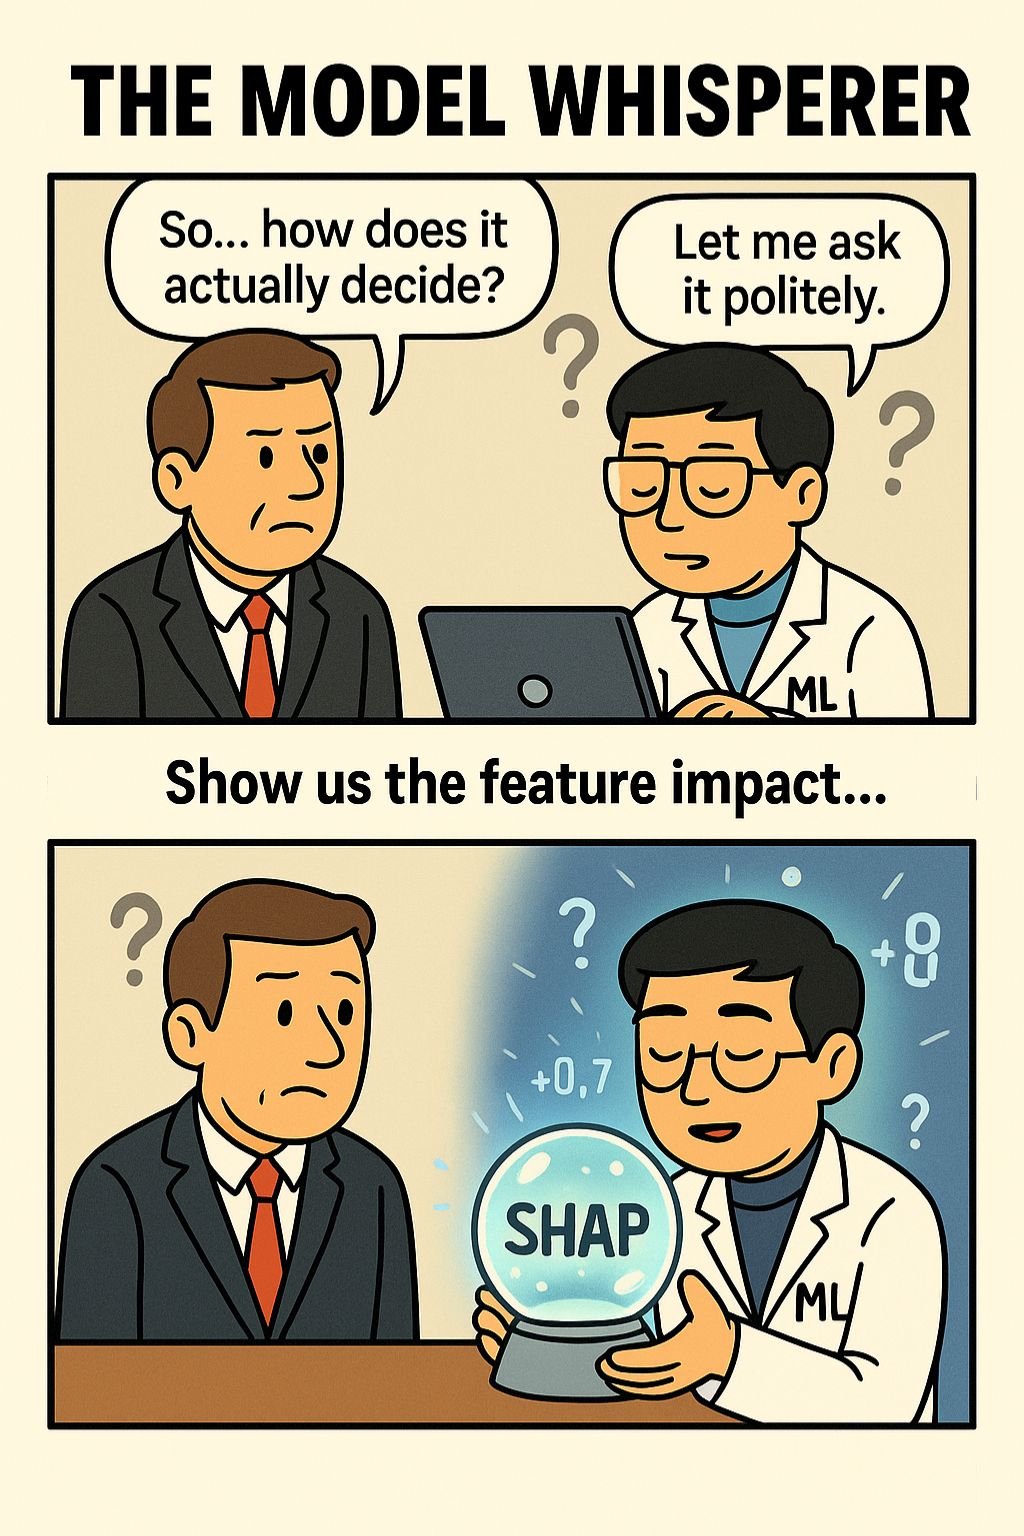
The Model Whisperer
Stakeholder: “Can the model explain itself?”
Data Scientist: “It speaks… but only in SHAP.” 🤯📊
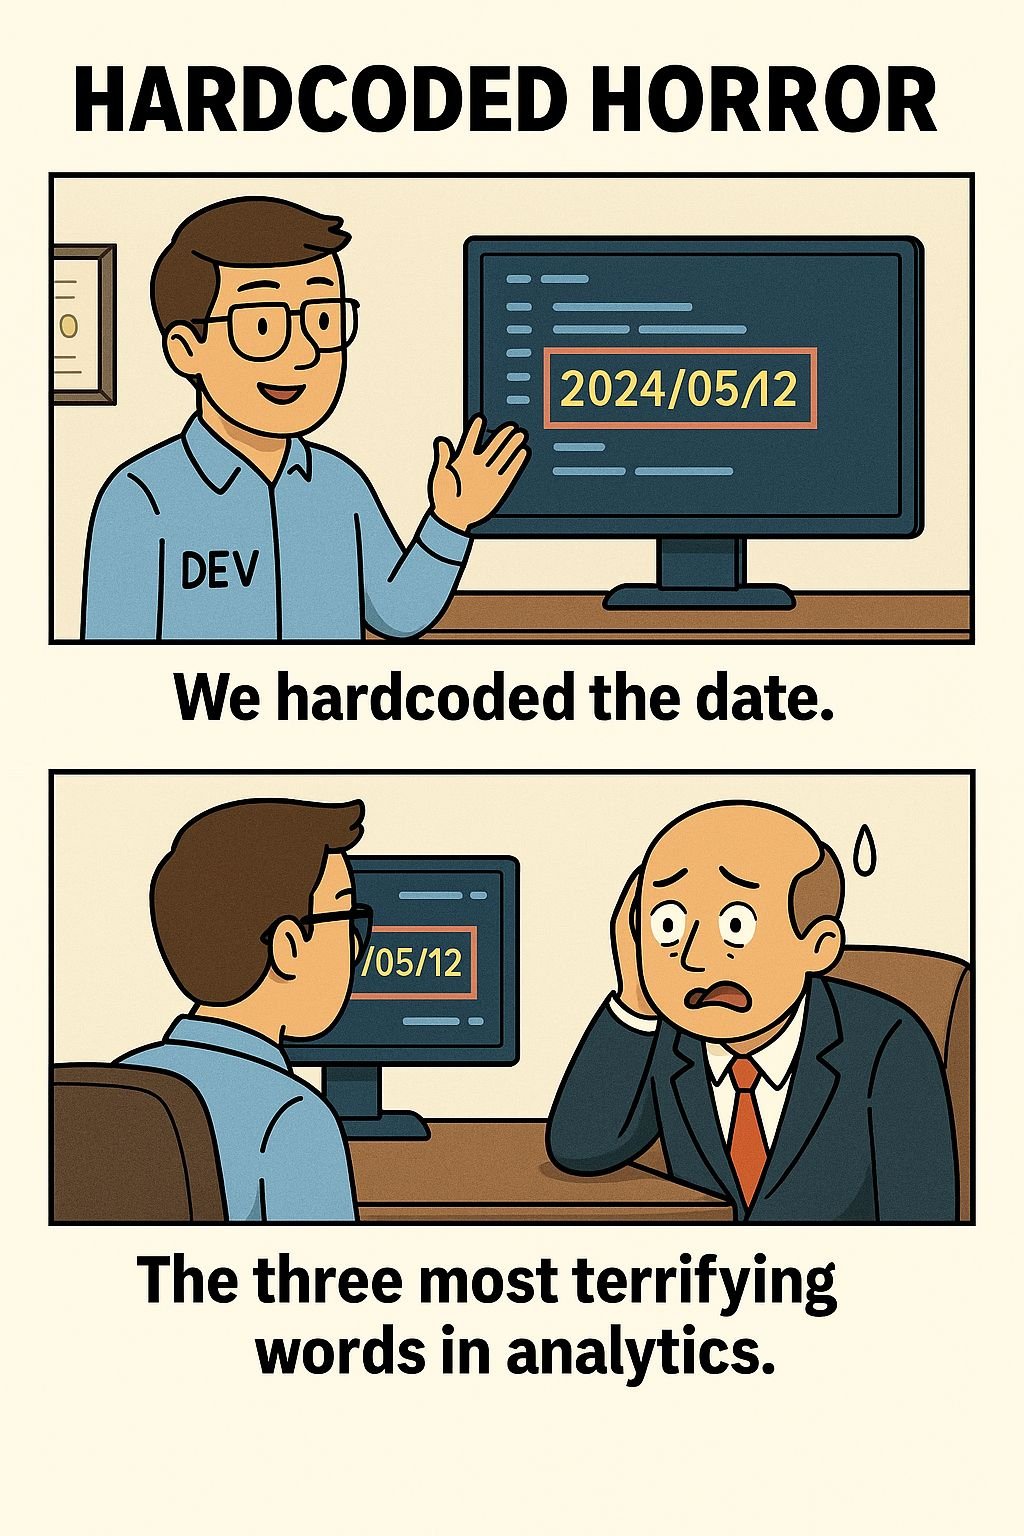
Hardcoded Horror
“We hardcoded the date.”
The three most terrifying words in analytics. 💀
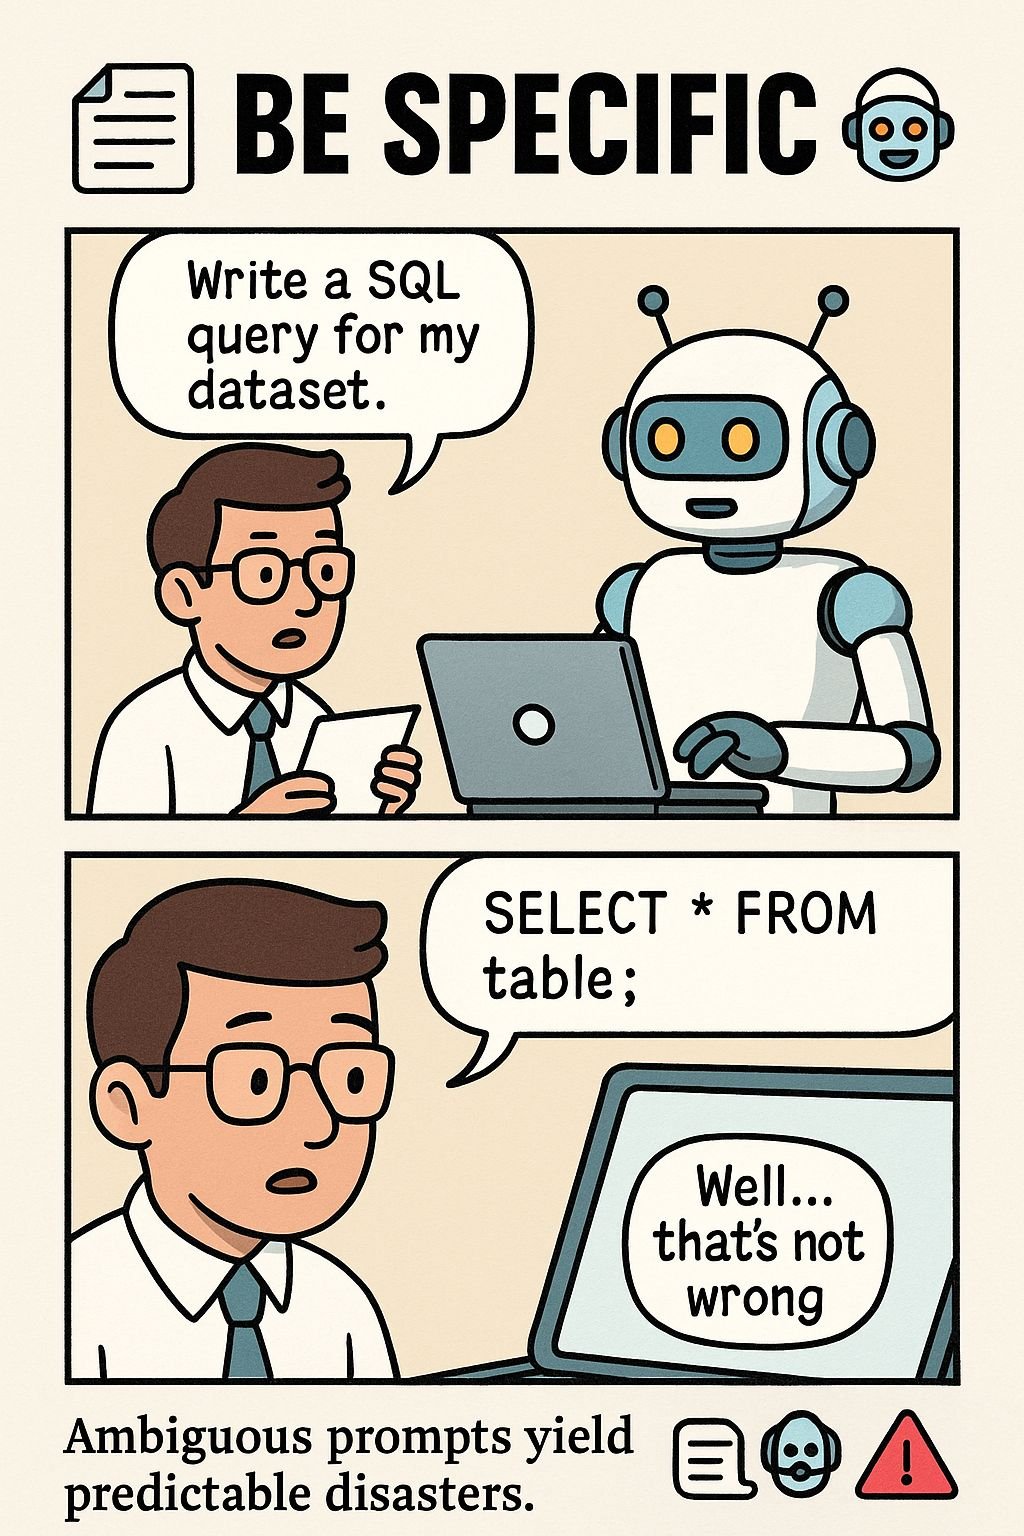
Be Specific
“Write a SQL query.” – SELECT * FROM table; 🙃 Prompting matters.
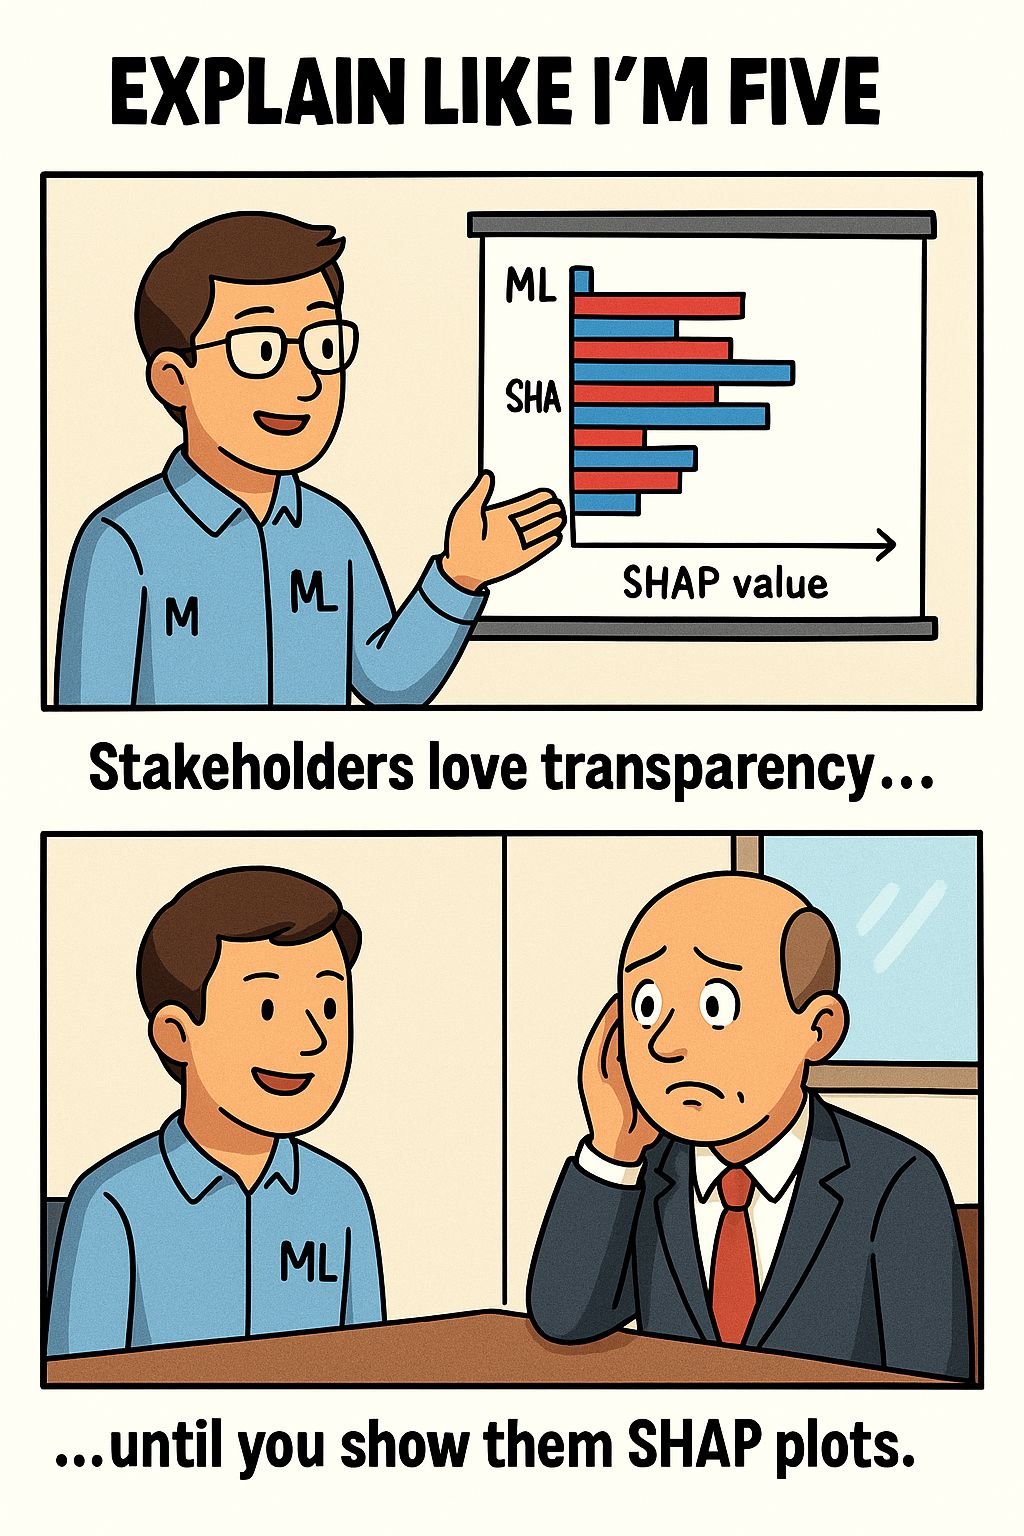
Explain Like I’m Five
Stakeholders want transparency... until you show them SHAP plots. 😵
