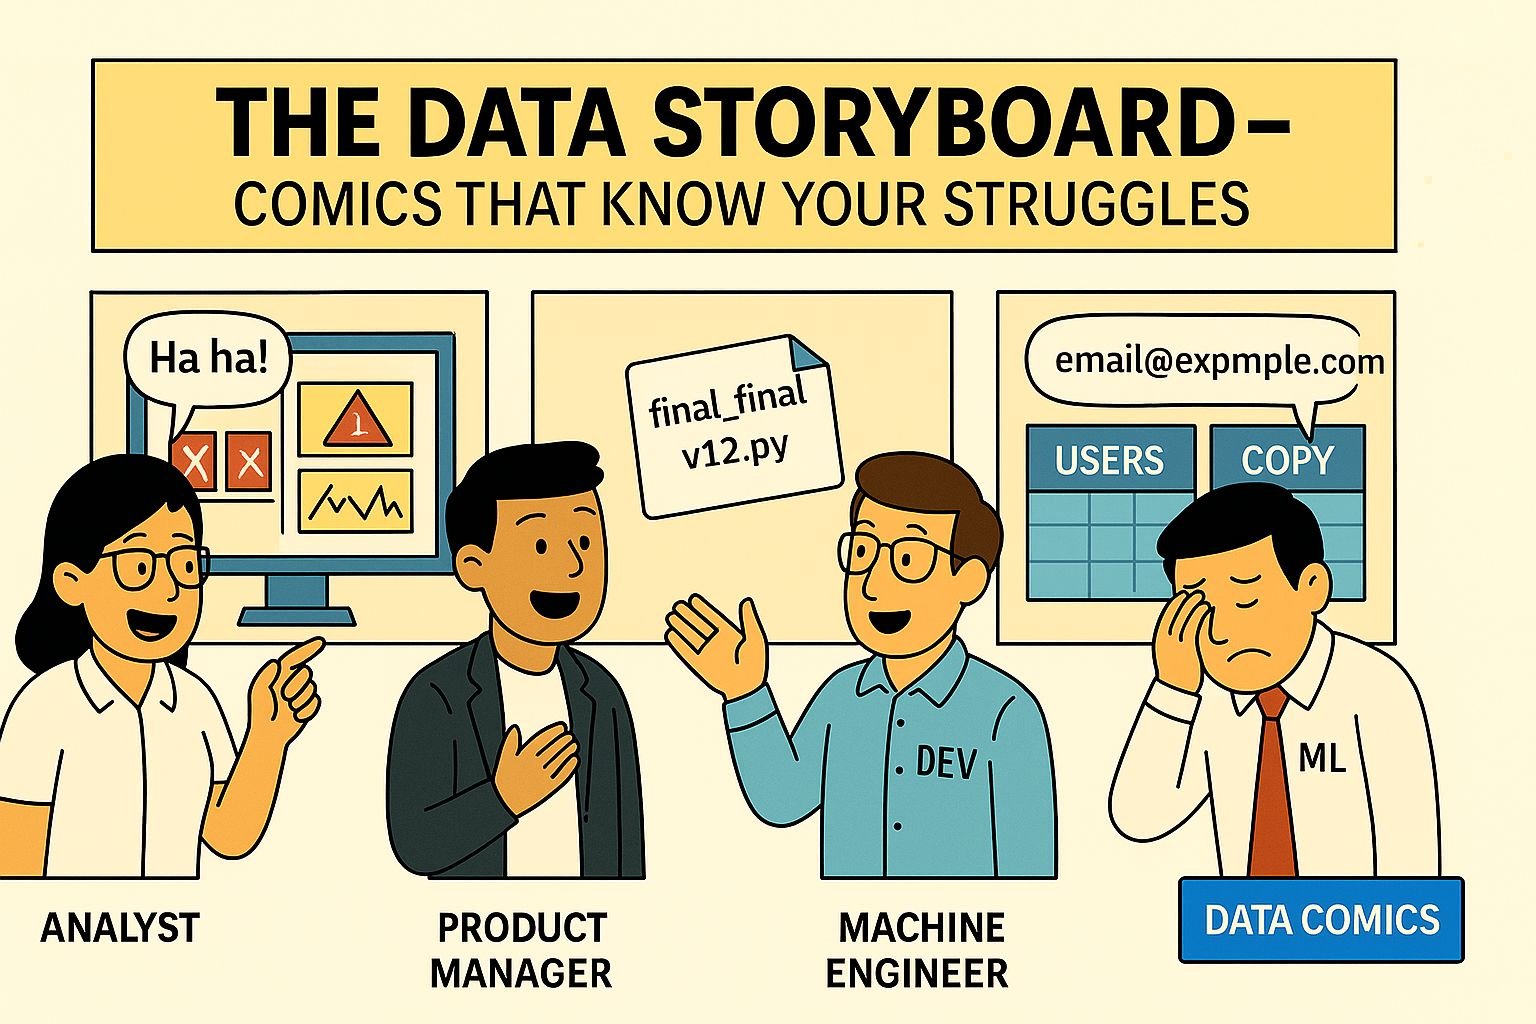
The Data Storyboard – Relatable Comics for Data Pros
Welcome to The Data Storyboard by DataComics — a comic strip series dedicated to the everyday challenges of data teams. If you’ve ever debugged at 2 a.m., this is for you.
🇮🇳🏆 The Fire in Blue: A Visual Reflection on the 2025 Women’s World Cup
Every champion’s journey starts far from the stadium lights. Chapter 1 reveals how India’s Women in...
🎖️ Operation Sindoor – Multi-Panel Visual Series
In Episode 1 of the India–Pakistan Conflict 2025 visual story, the war hasn’t started—but the...
🌌 The Illustrated Universe of DataComics
What happens when a “Model-in-Training” joins the team meeting? Early-career anxiety meets machine...
🌀 The Complete Collection – A Swipe Through Data Chaos
From hardcoded horrors to broken dashboards, this is where every comic comes together. Missed one? Dive into the chaos.
Your words carry quiet authority, guiding the reader with calm confidence. Each sentence supports reflection, fosters introspection, and nurtures a thoughtful, immersive experience that combines intellectual and emotional resonance.
Thank you for such thoughtful feedback. 🙏 The intent behind Operation Sindoor Visual Story Series is exactly that—to create space for reflection while blending intellect and emotion. It means a lot to know the narrative is resonating in this way.