Laugh. Learn. Love Data.
📽️ Featured Series
Binge-worthy visual narratives. Start reading now.
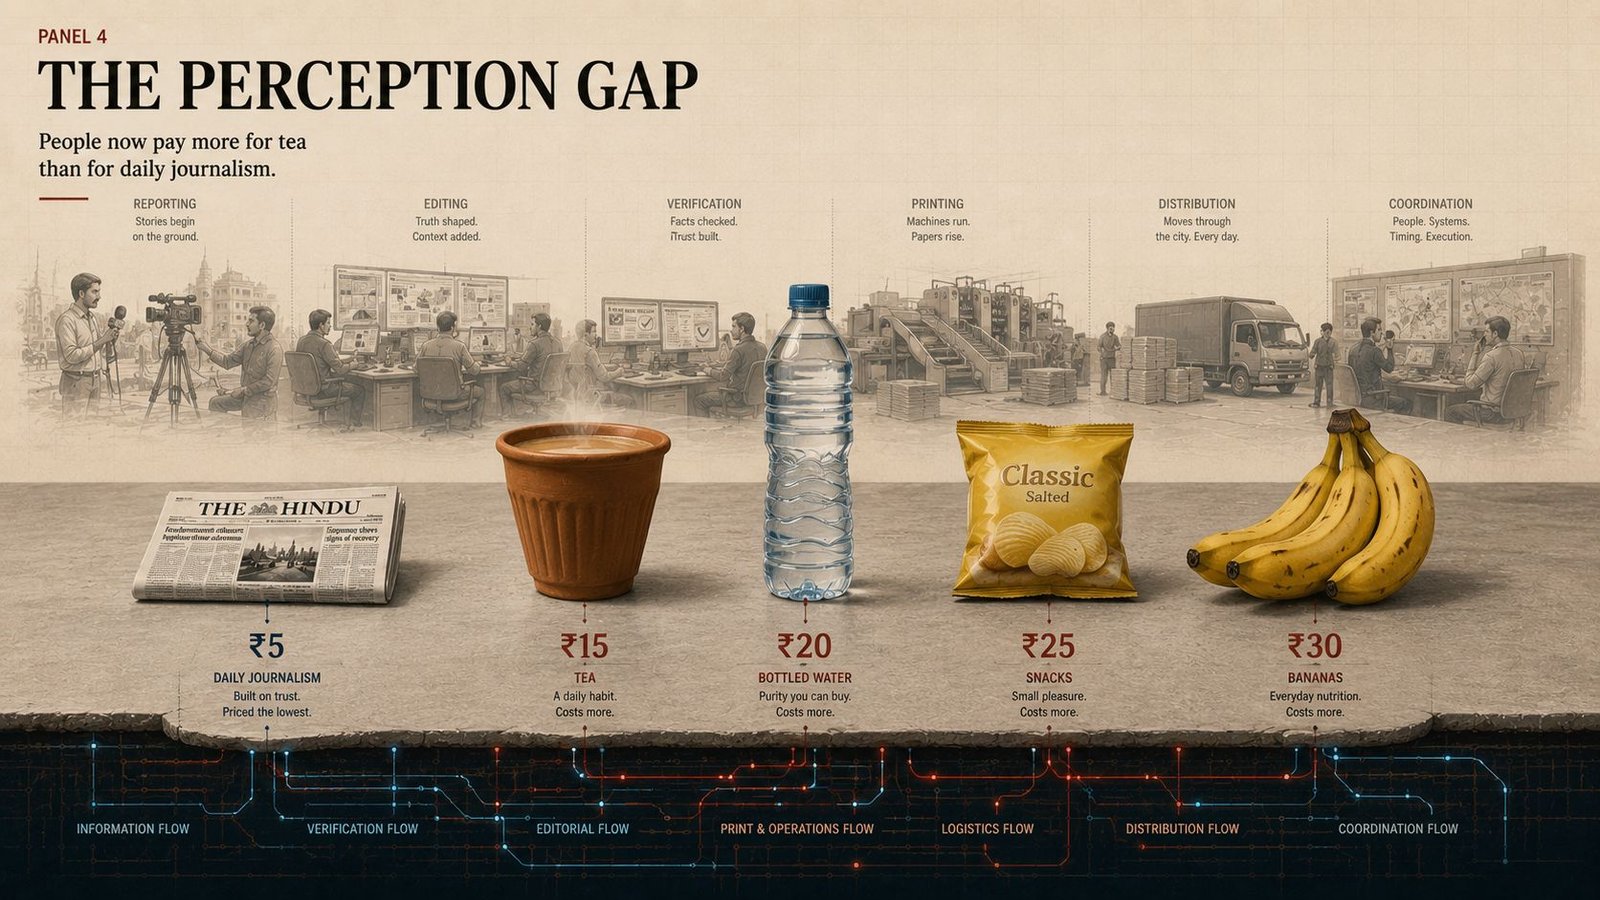
The Economics of Trusted News
A cinematic series on journalism, trust, and public information systems.
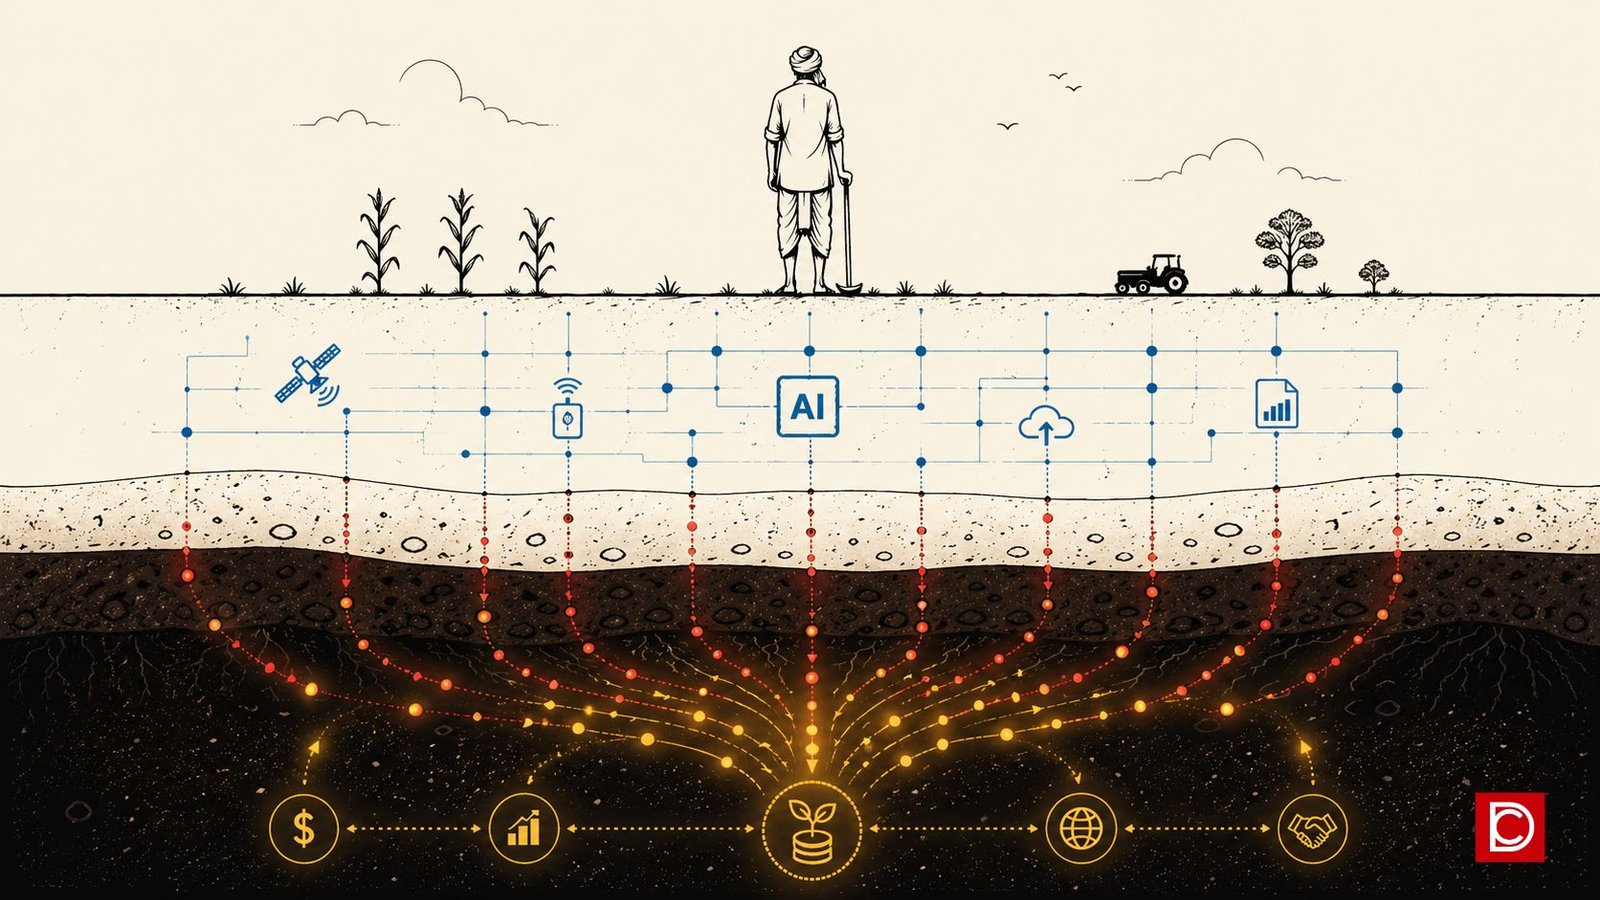
The Economy Beneath the Soil
How farming, carbon, and AI turn invisible climate work into measurable value.
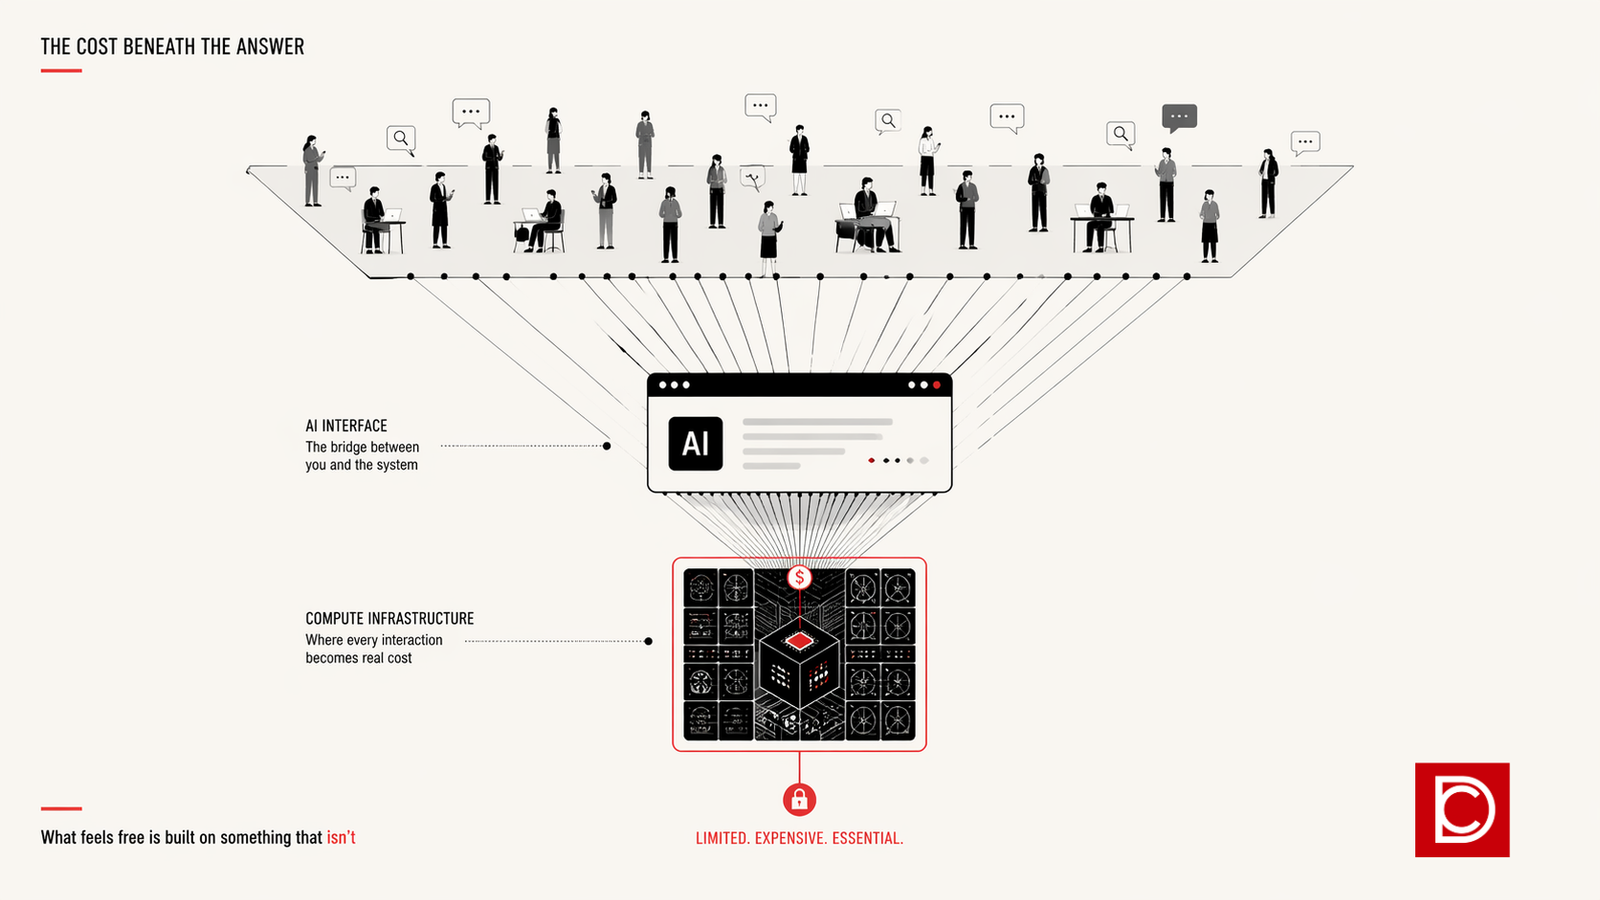
The Cost Beneath the Answer
A visual exploration of how AI systems scale, what they cost, and why constraints define their future.

The Fire in Blue
The untold journey of the Women in Blue to World Cup glory.

Operation Sindoor
2025 India-Pakistan Conflict: AI, Deterrence & Diplomacy.

Indigo Crisis 2025
Santa investigates why India's biggest airline stood still.
Comic Stream

The Untrained Intern

The Hallucination Apology Tour

The Feedback Loop

The Token Budget Meeting

Compliance-Constrained Agent

The Context Window Shrink

The Model That Wanted a Promotion

Data Scientist’s Diet

Prompt Inflation

API Rate-Limit Riot

RAG Became Wreckage

Hallucinated Citation

Prompt Injection Panic

Slide Before Truth

The Dashboard Detective
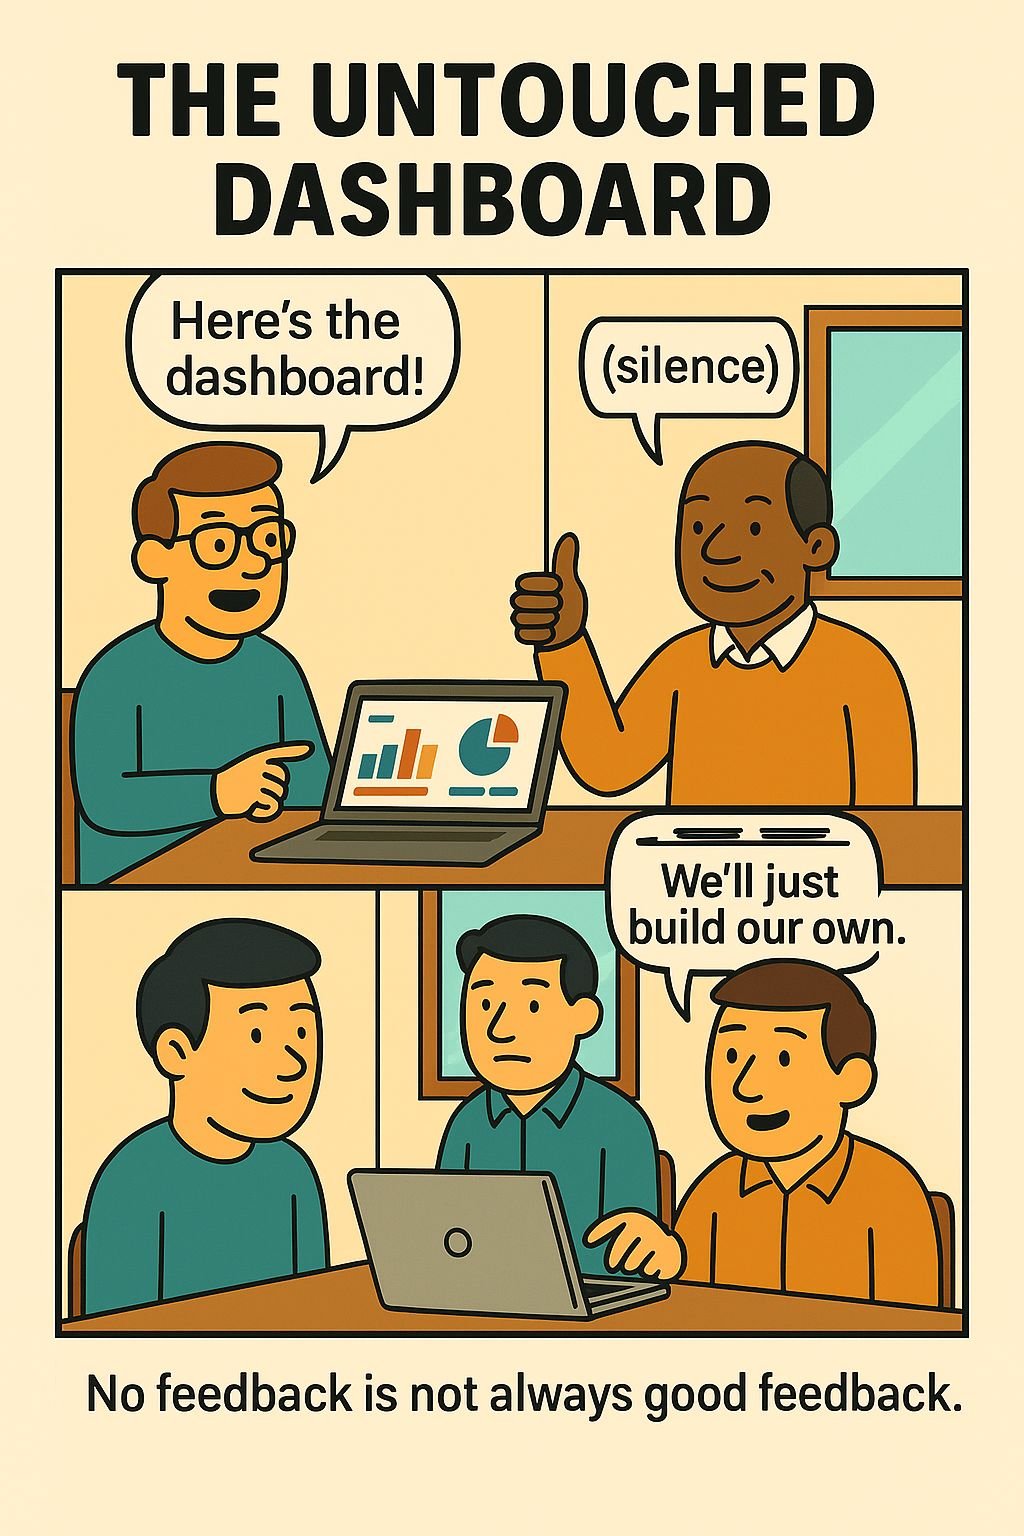
The Untouched Dashboard
AI Said So

Delete Without WHERE
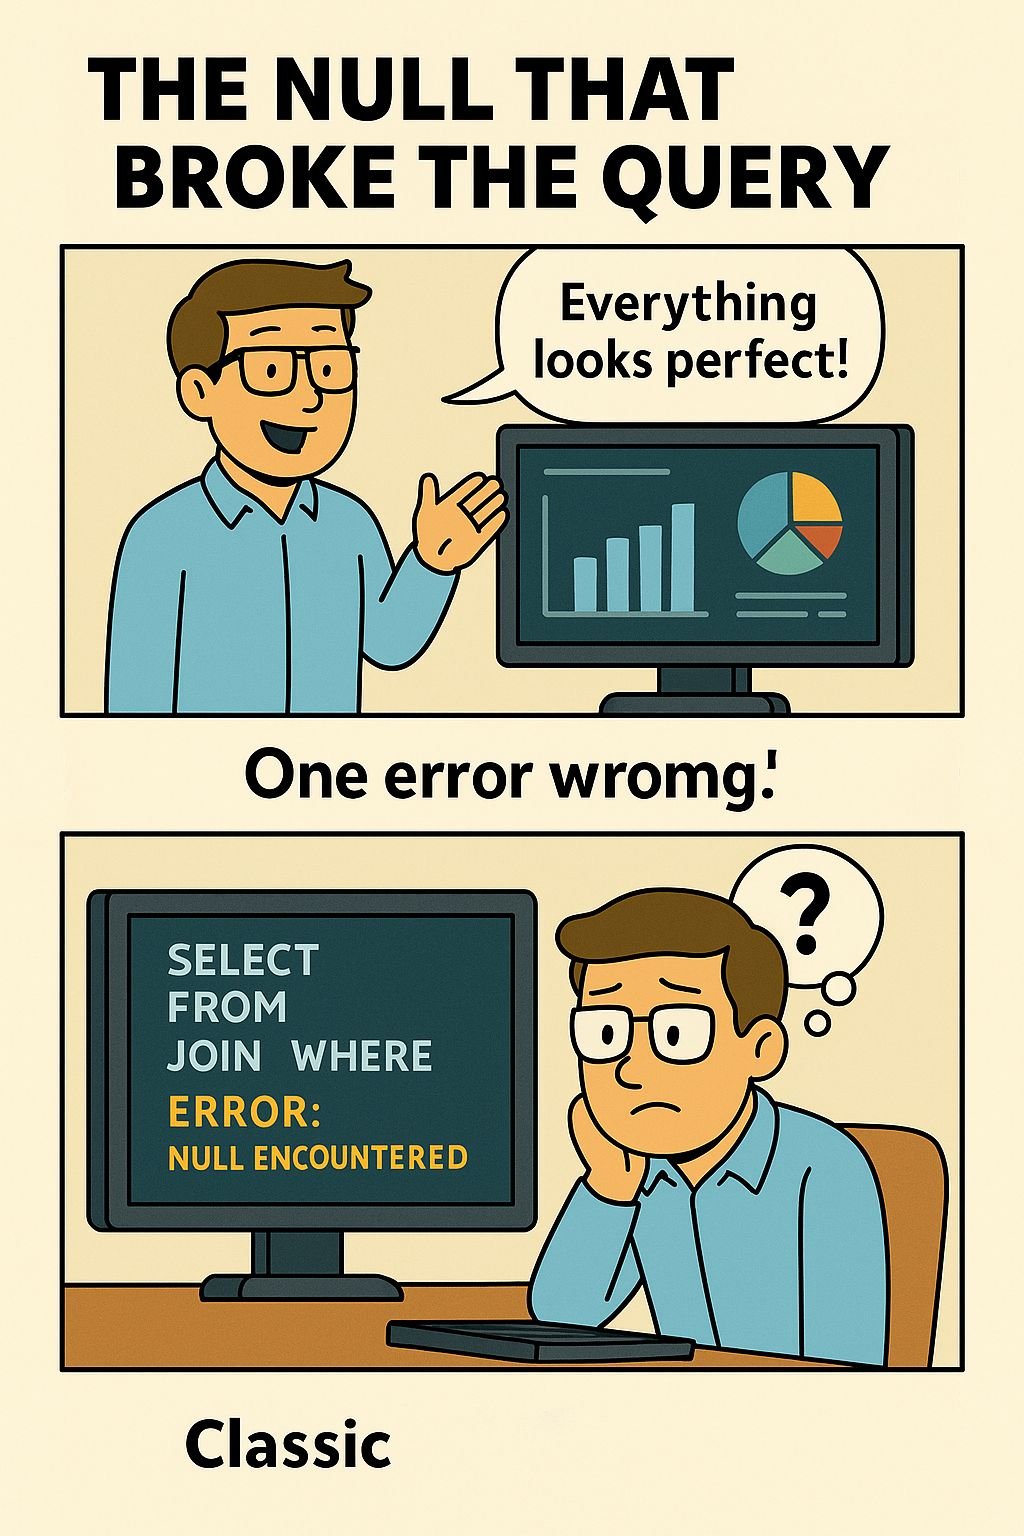
Null SQL Query
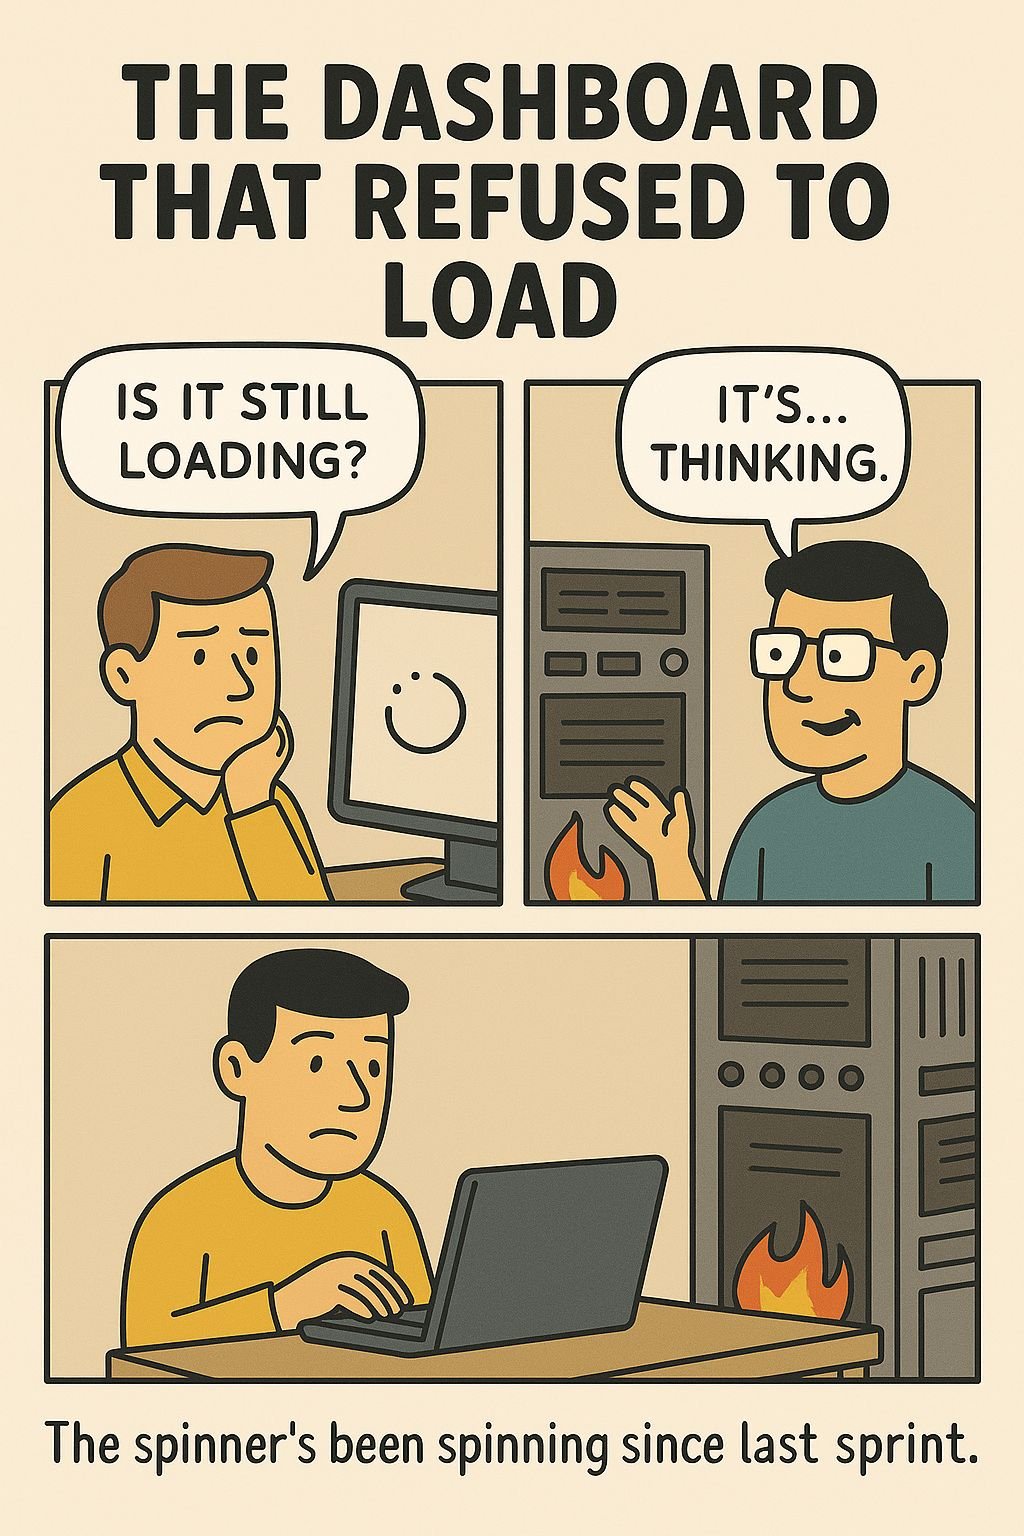
The Dashboard Loading

Real-Time Dashboard
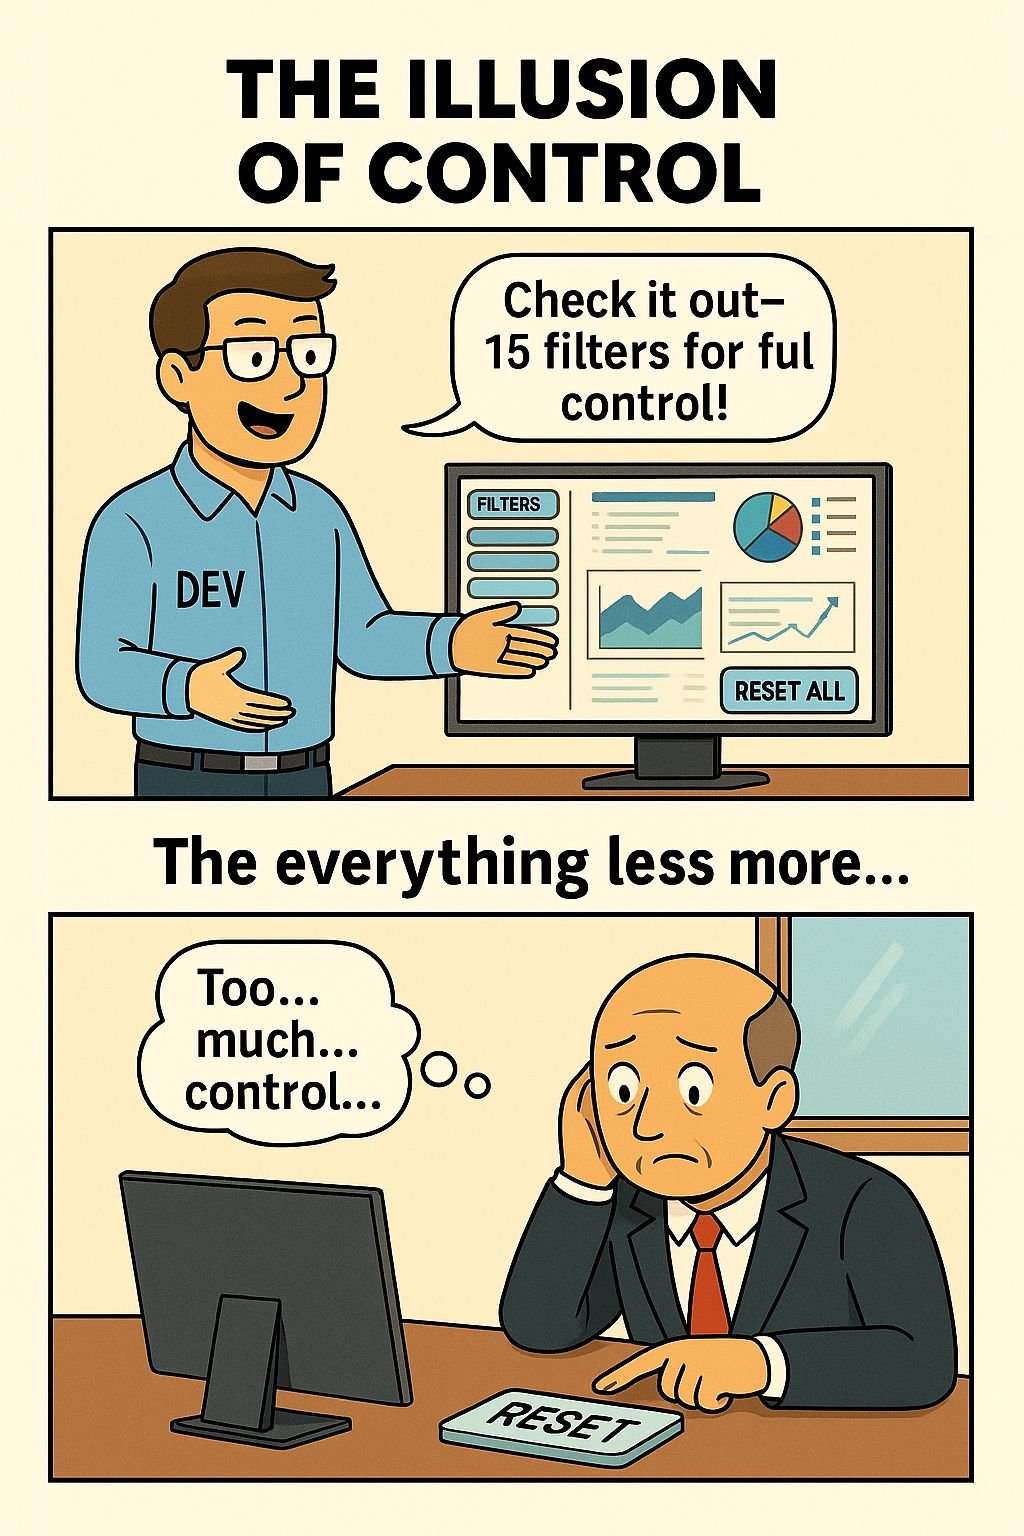
Illusion of Control Dashboard
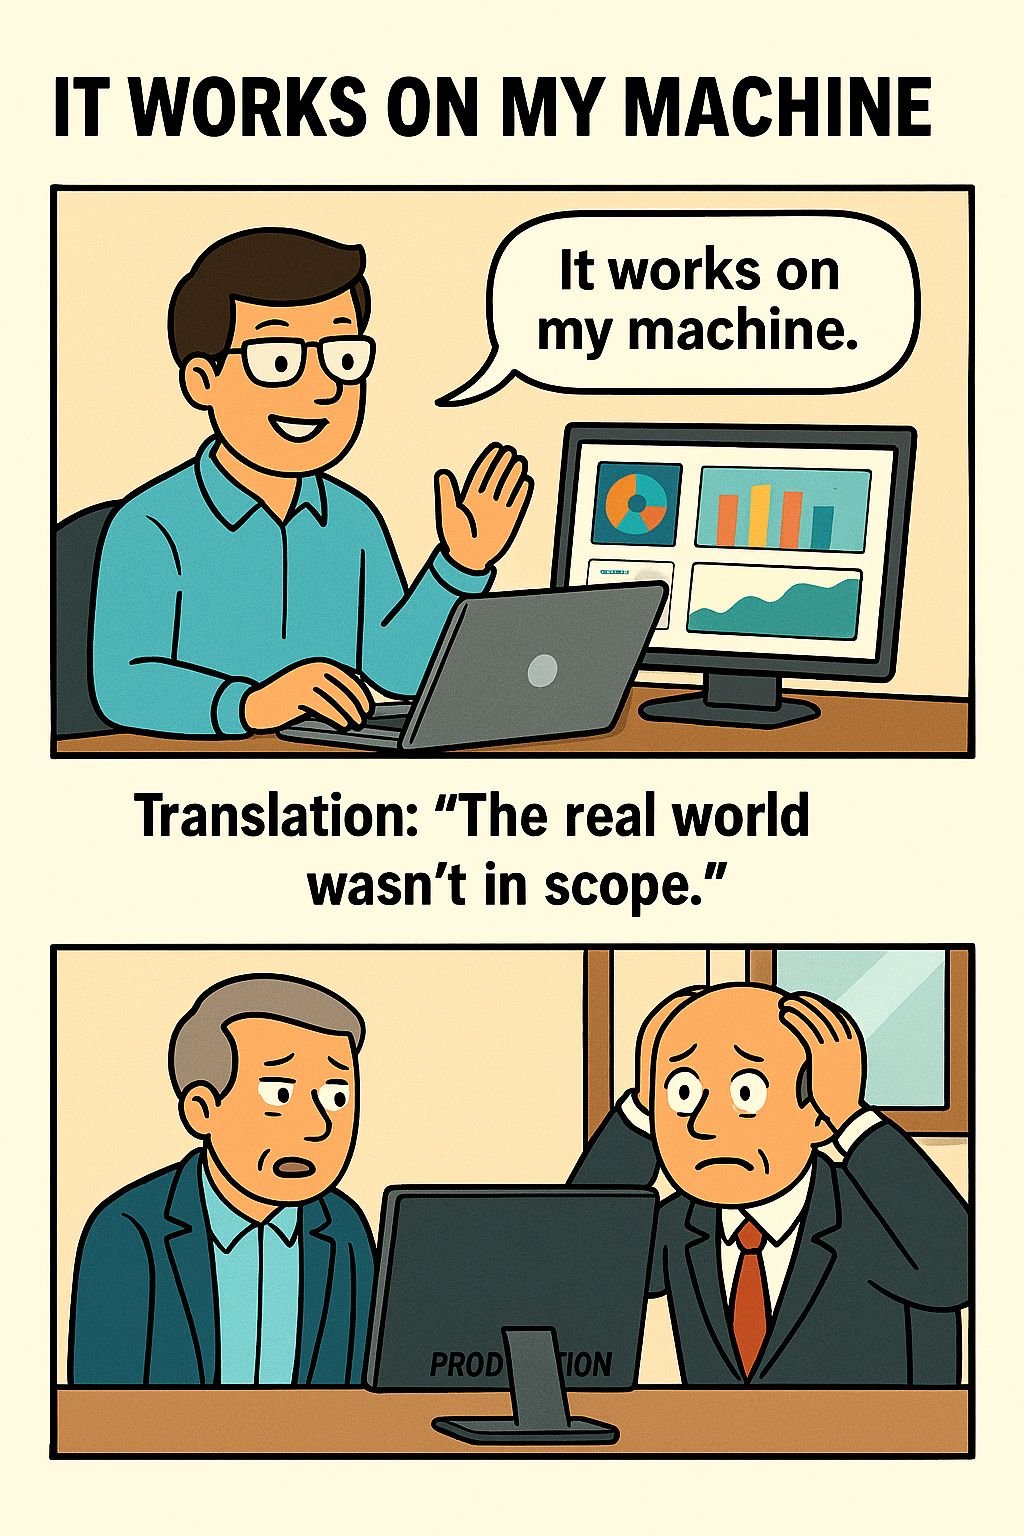
It Works On My Dashboard
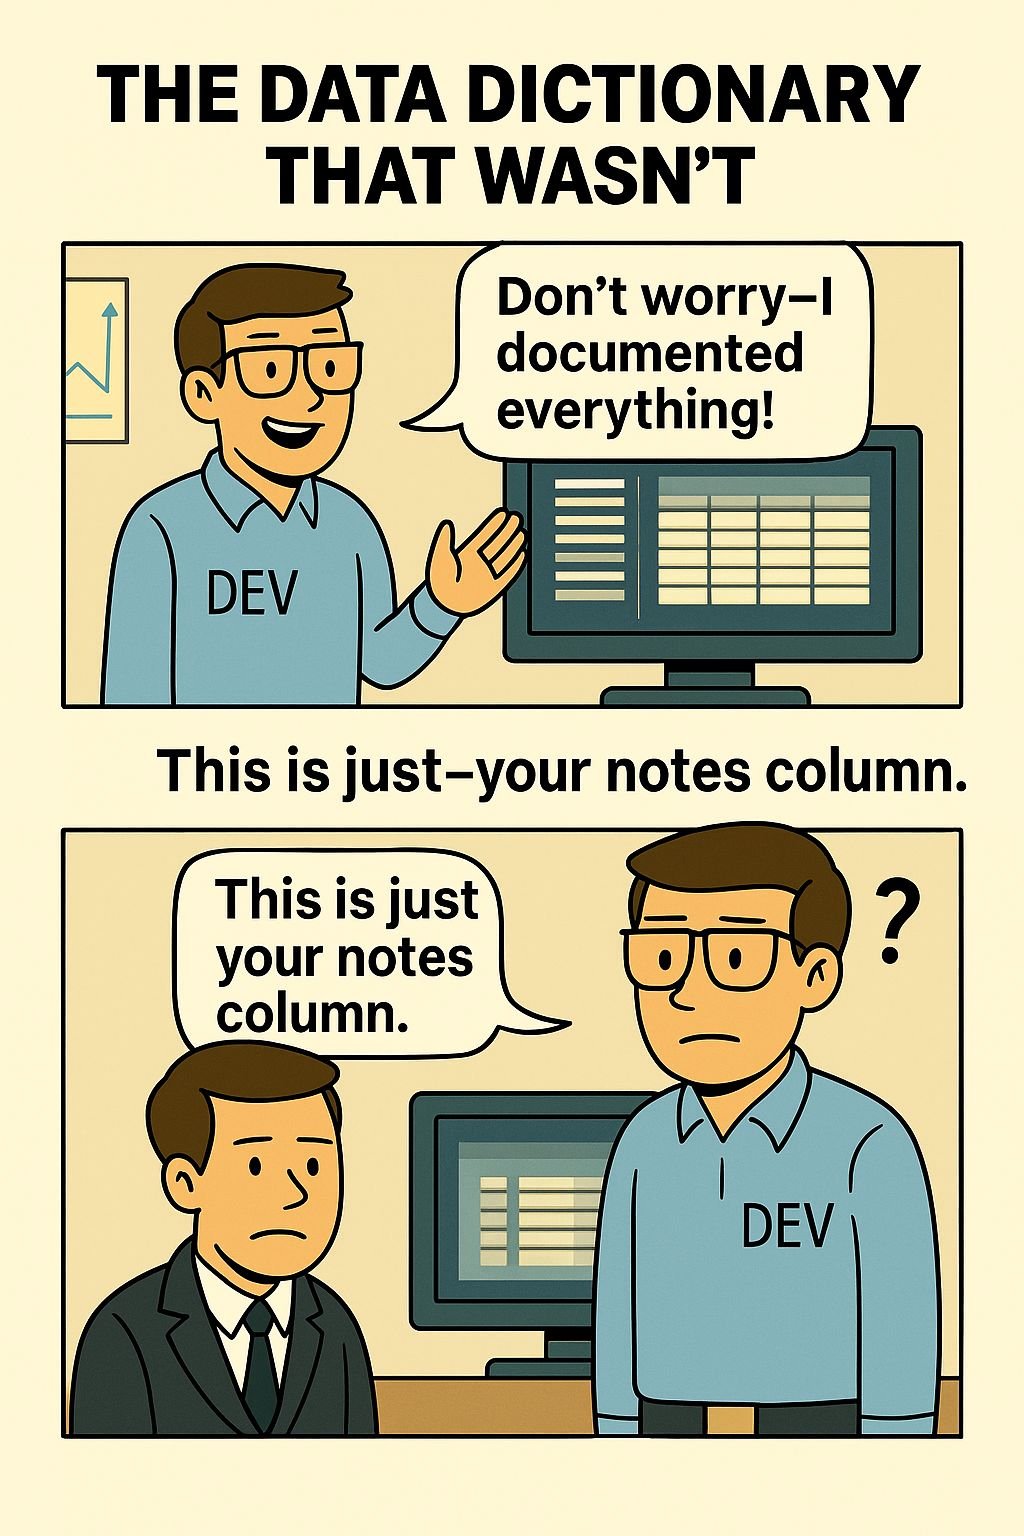
The Data Dictionary That Wasn’t
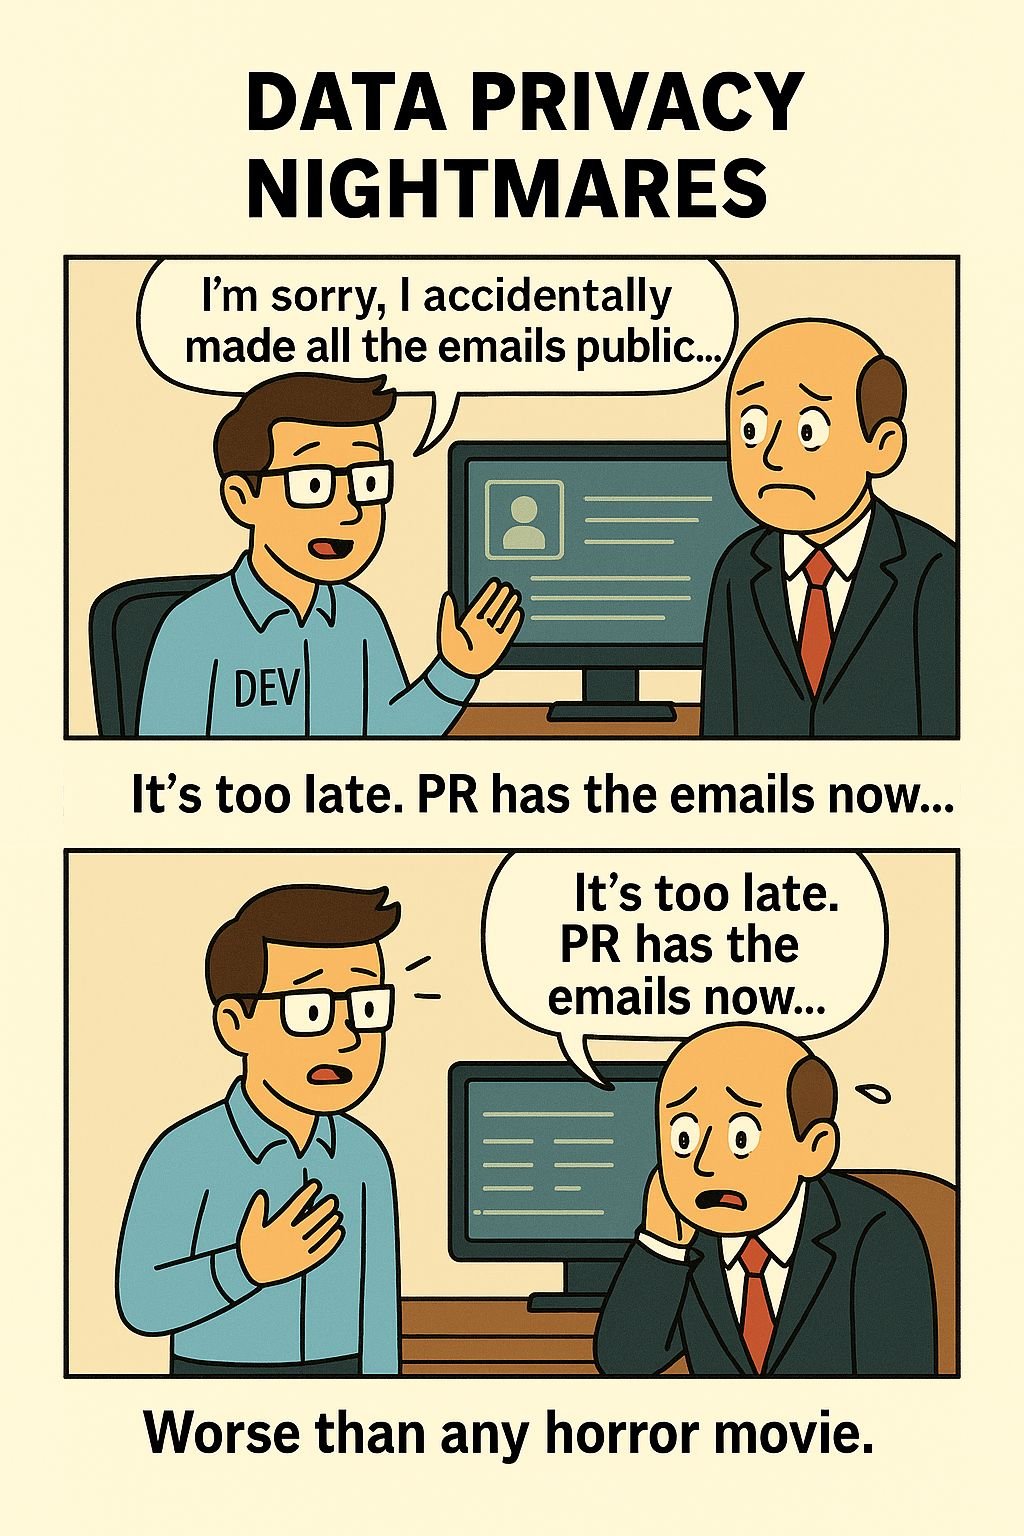
Accidental Data Leak
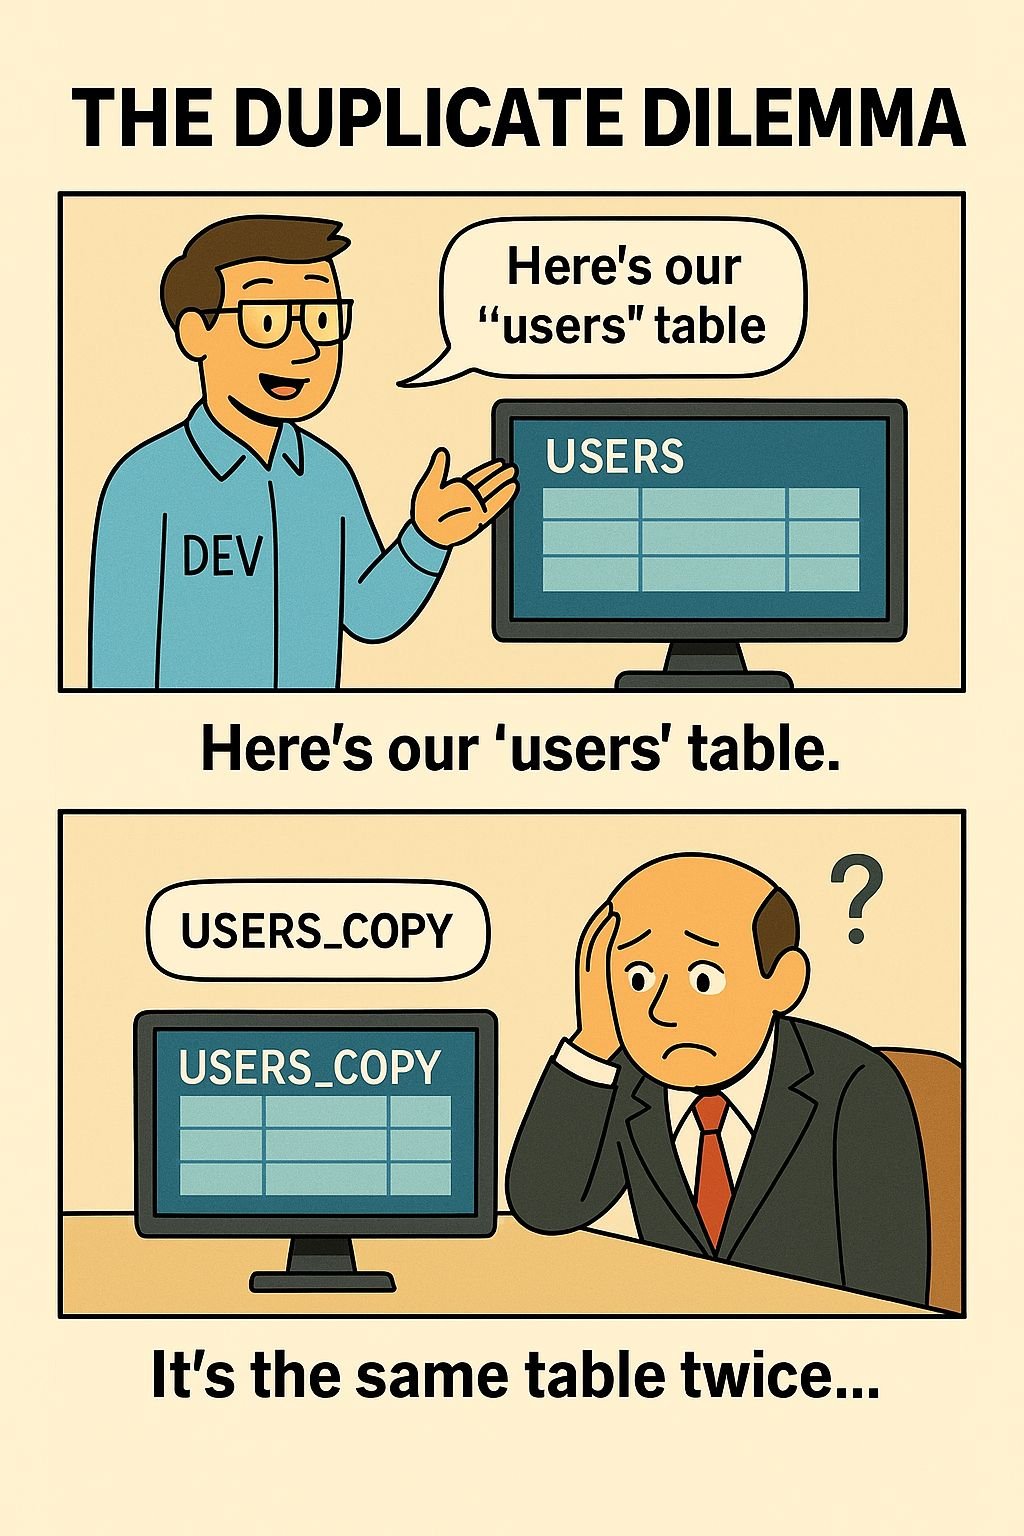
Duplicate Dilemma
Latest Comics
📊 KPI Bloat Syndrome
“More KPIs = More clarity!”
“Which of these even matters?”
When data quantity overrides data clarity.
📈 Metric of the Month
NPS. DAU. Retention. Smile Time.
New week, new obsession.
The KPI carousel never stops spinning.
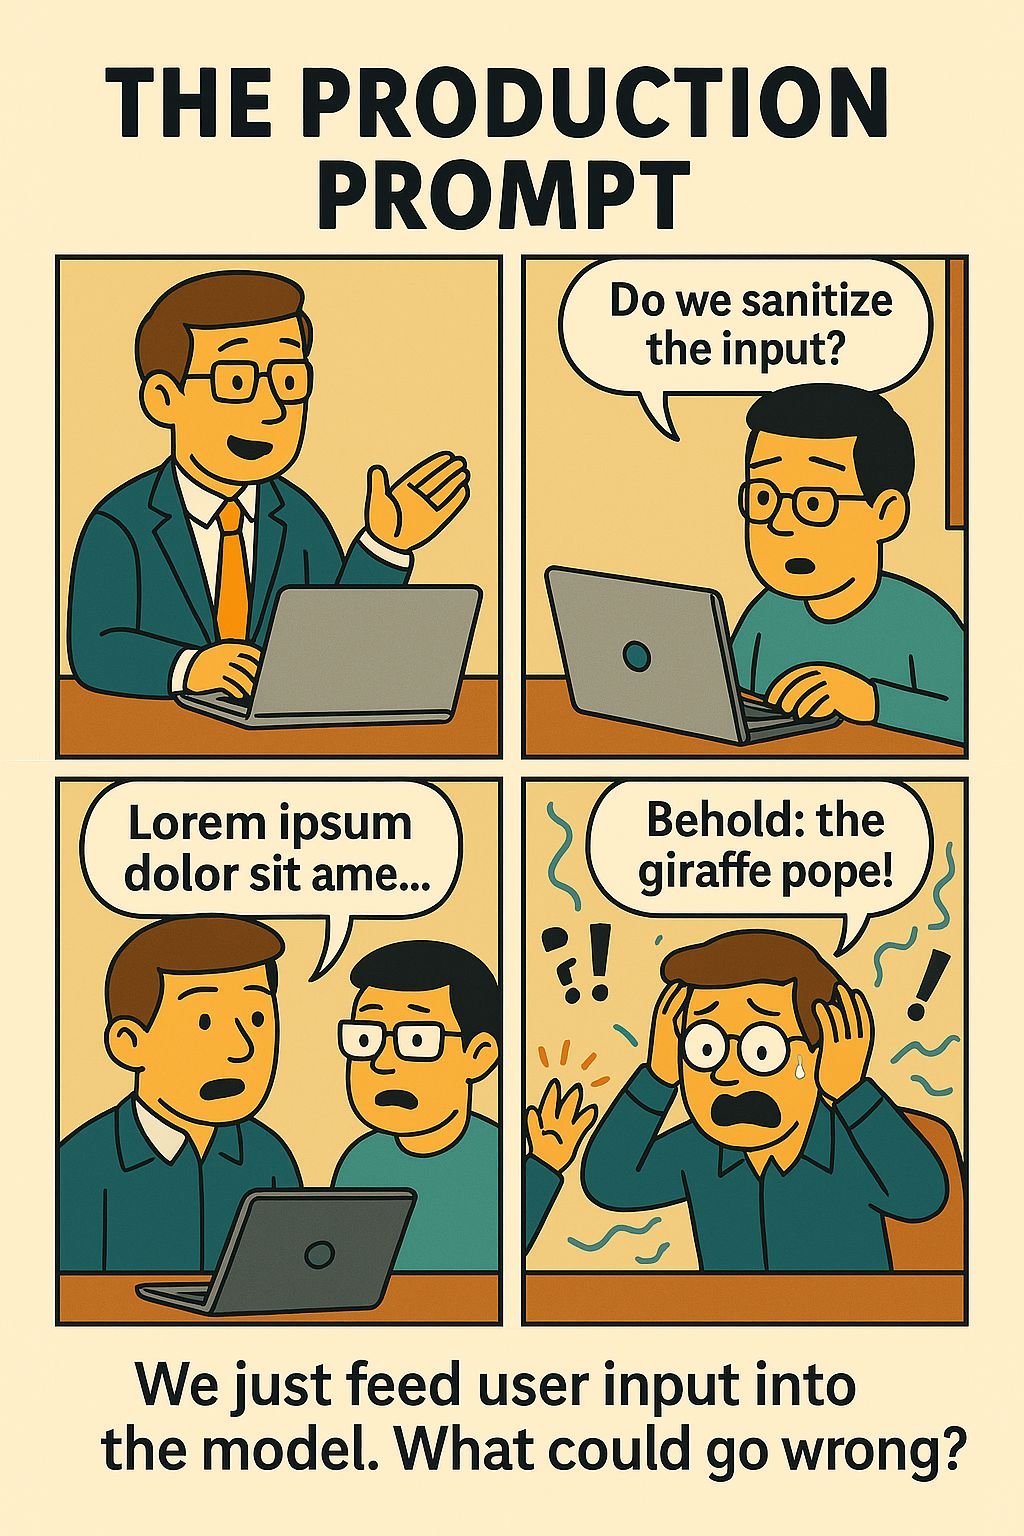
🤖 The Production Prompt
“Do we sanitize input?”
“The model’s smart.”
Live demo: Lorem ipsum… Giraffe Pope… panic.
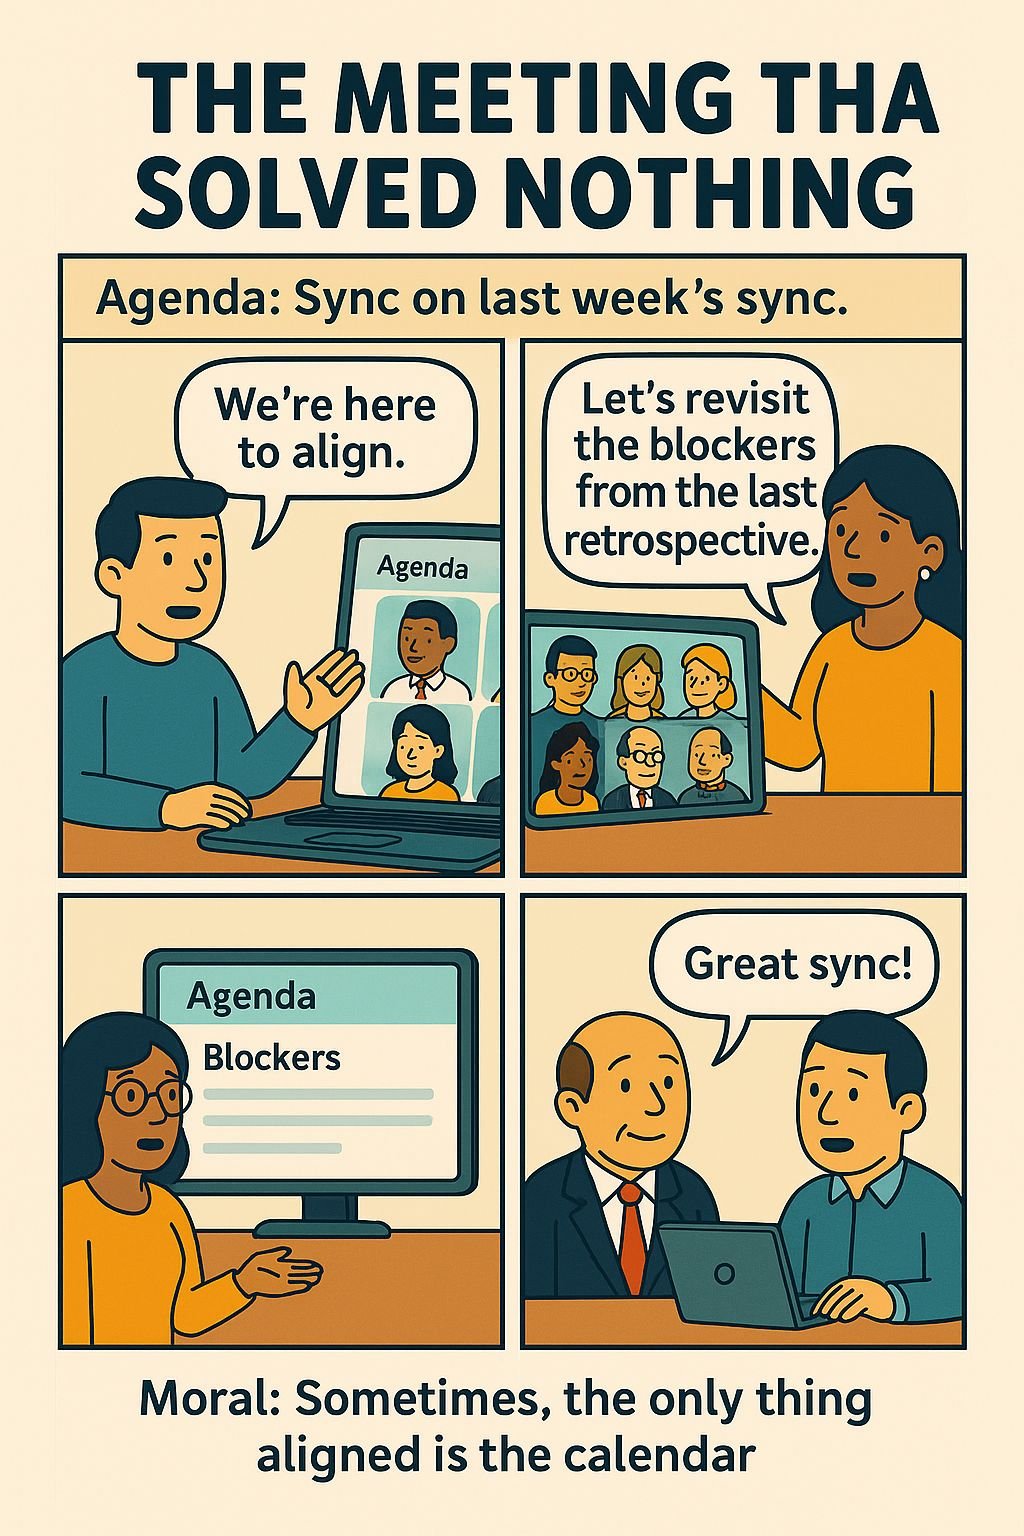
📅 The Meeting That Solved Nothing
“We’re here to align.”
“Let’s revisit blockers from last week’s sync.”
One hour later: “Great sync!” Calendar wins again.
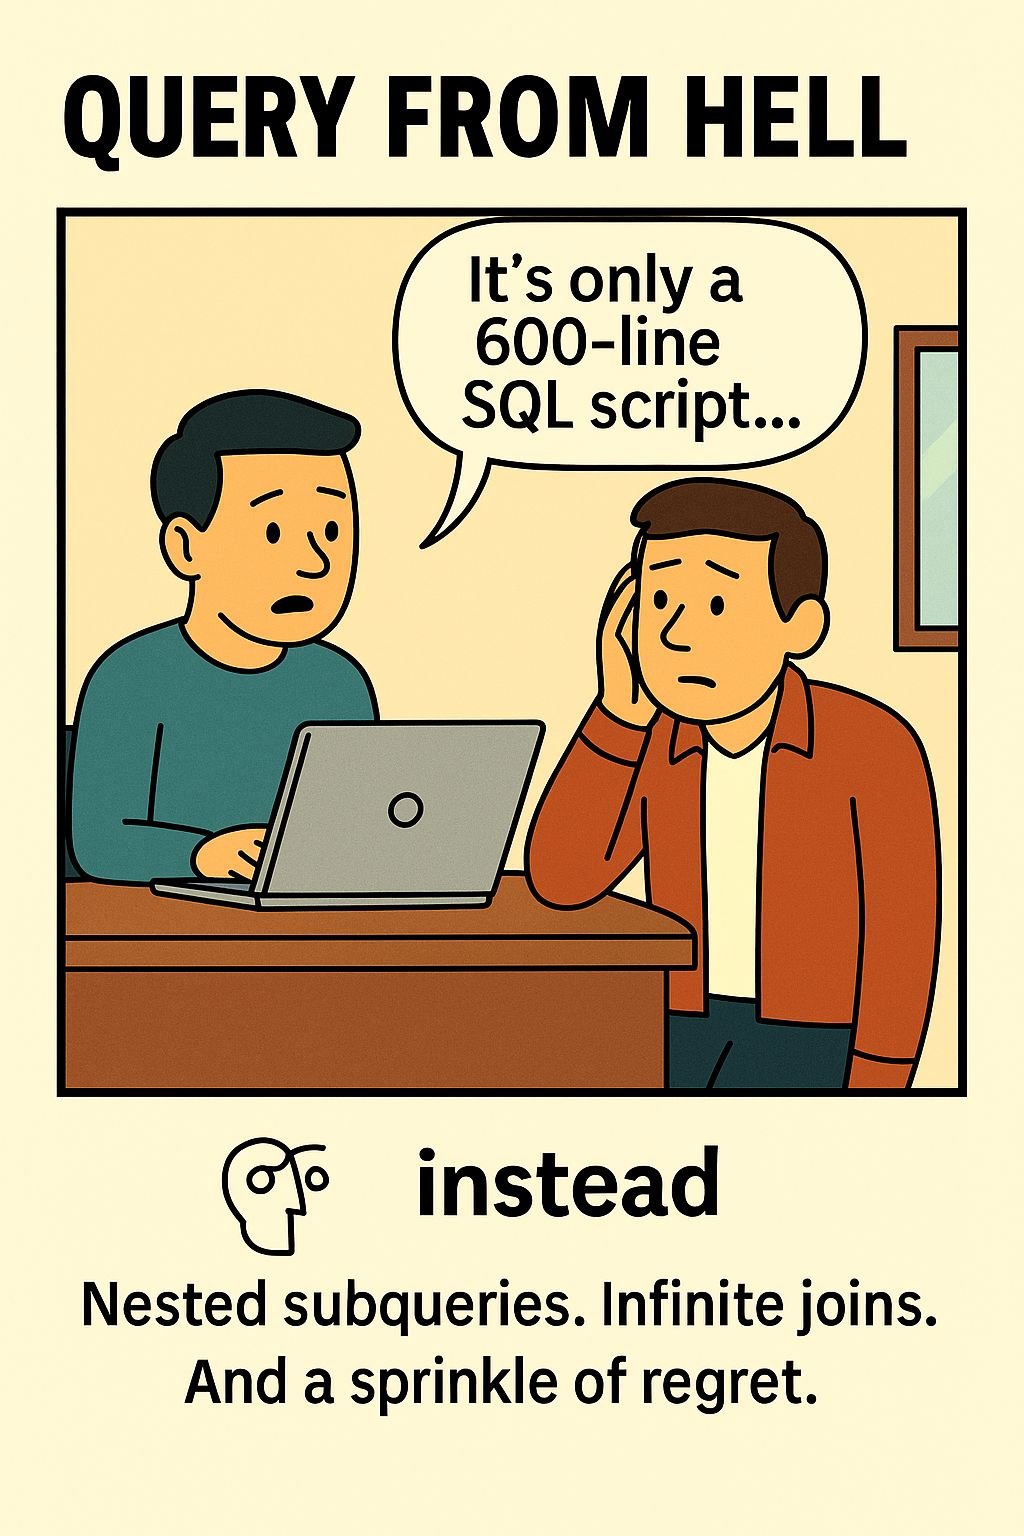
🧪 Query from Hell
Dev: “It’s only a 600-line SQL script…”
Colleague: “Who hurt you?”
Nested subqueries. Infinite joins. A sprinkle of regret.
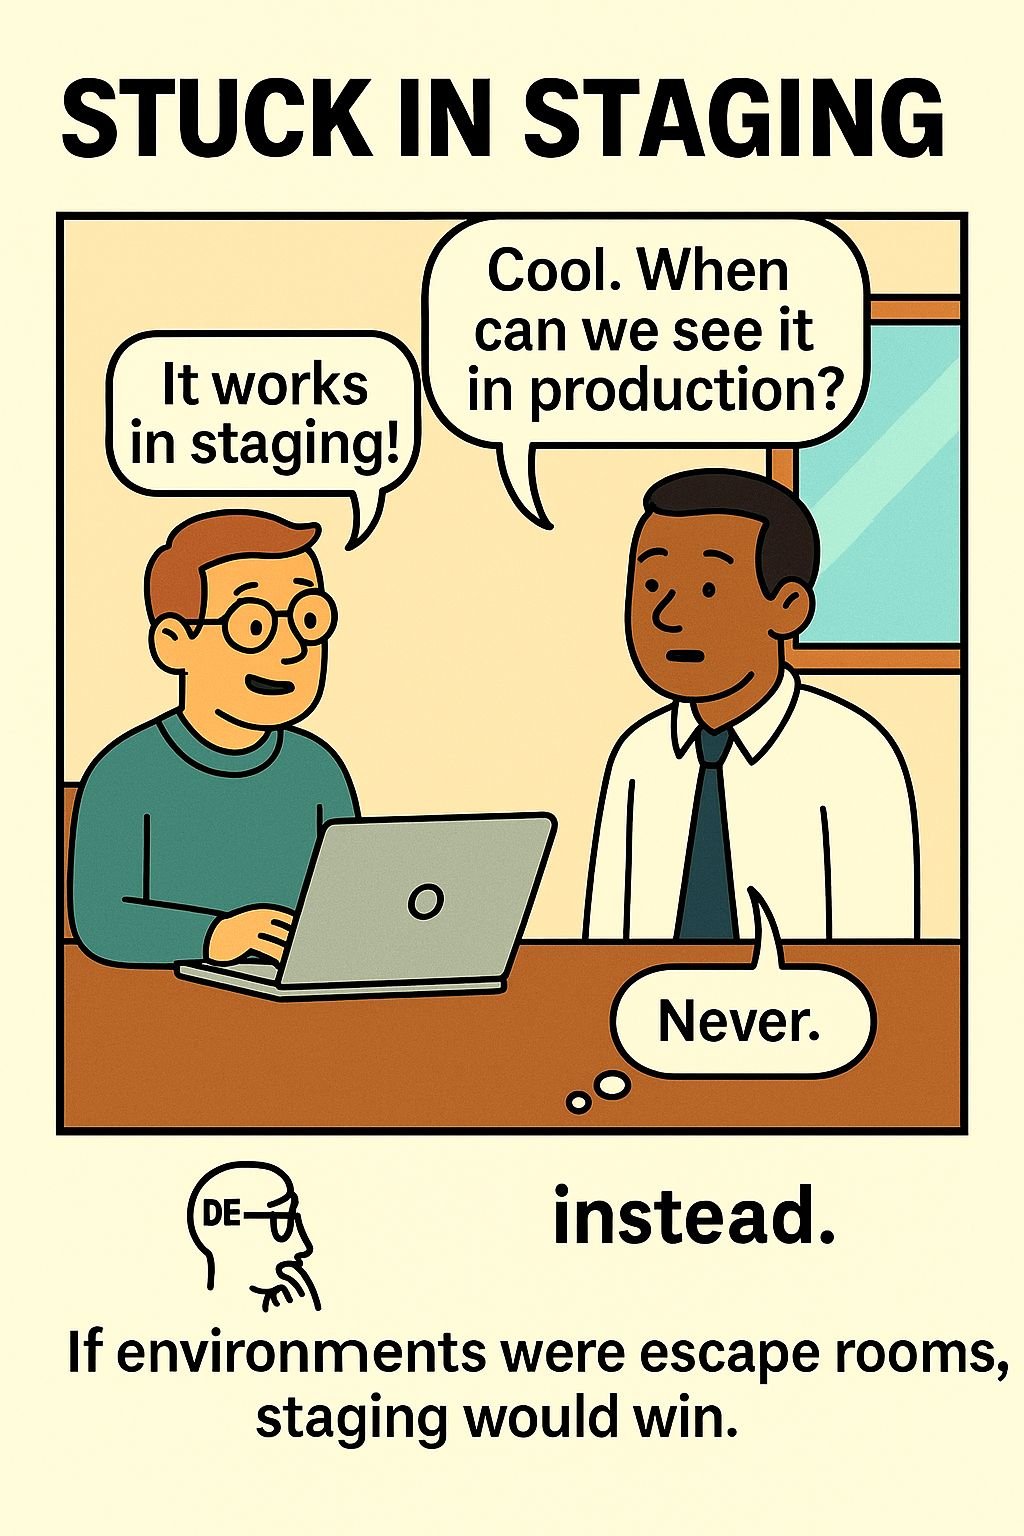
⚙️ Stuck in Staging
Data Engineer: “It works in staging!”
QA: “Cool. When can we see it in prod?”
Whispers: “Never. It lives there now.”
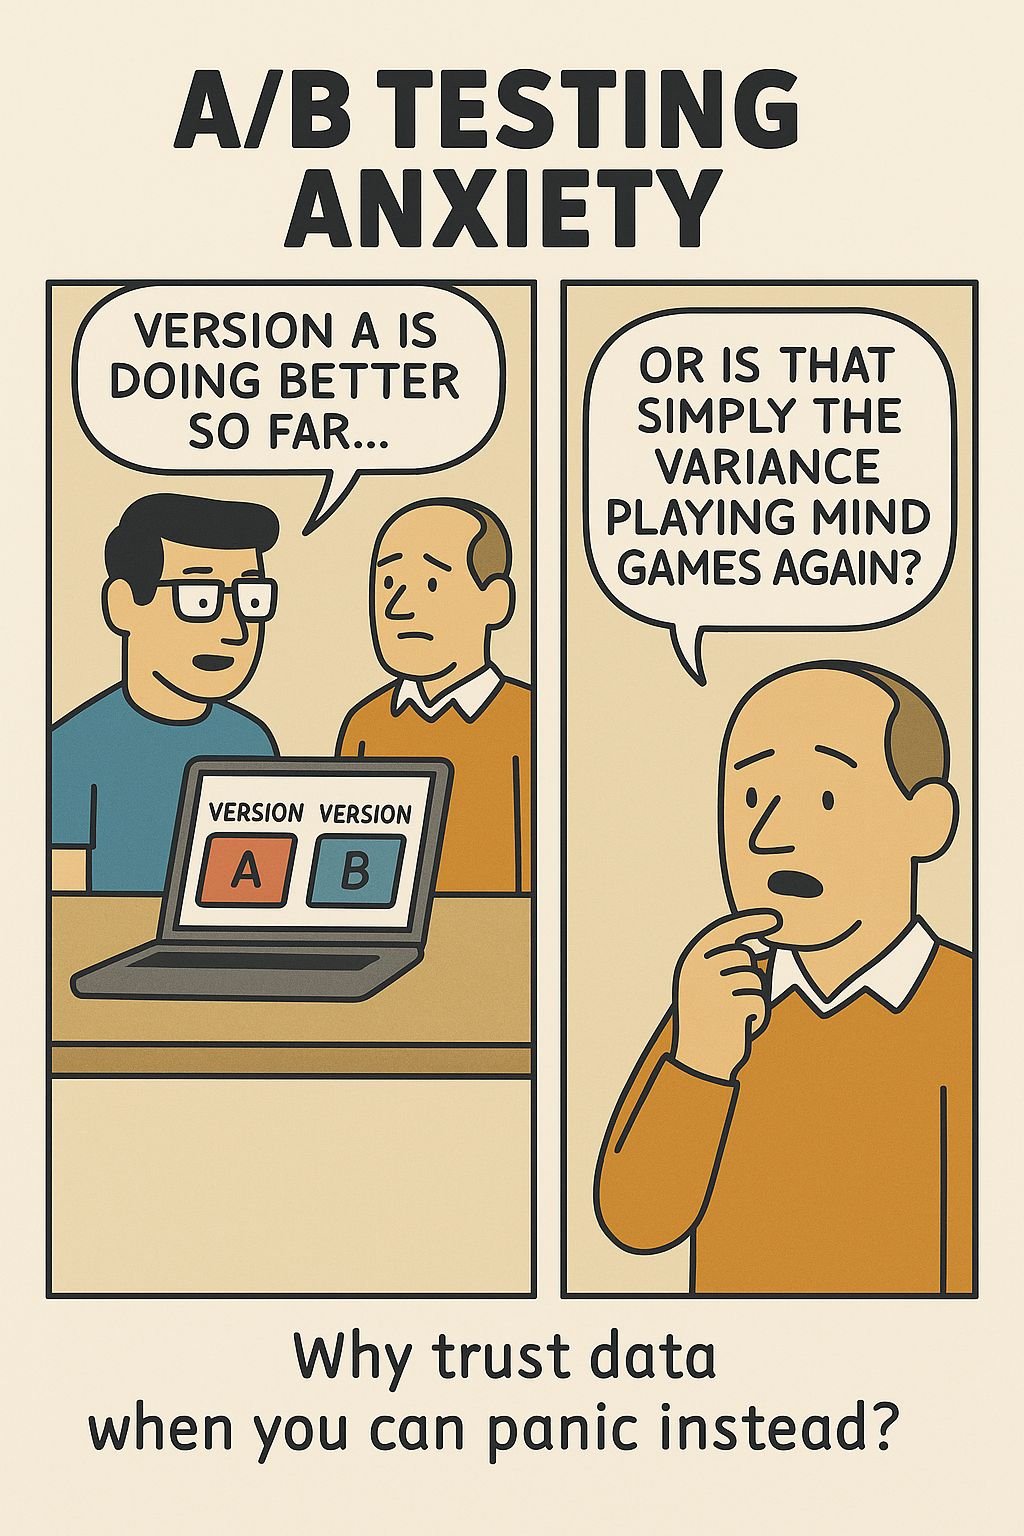
🧪 A/B Testing Anxiety
PM: “Which version won?”
Analyst: “A was worse than B. But B was worse than A...”
Confidence intervals = confidence crisis.
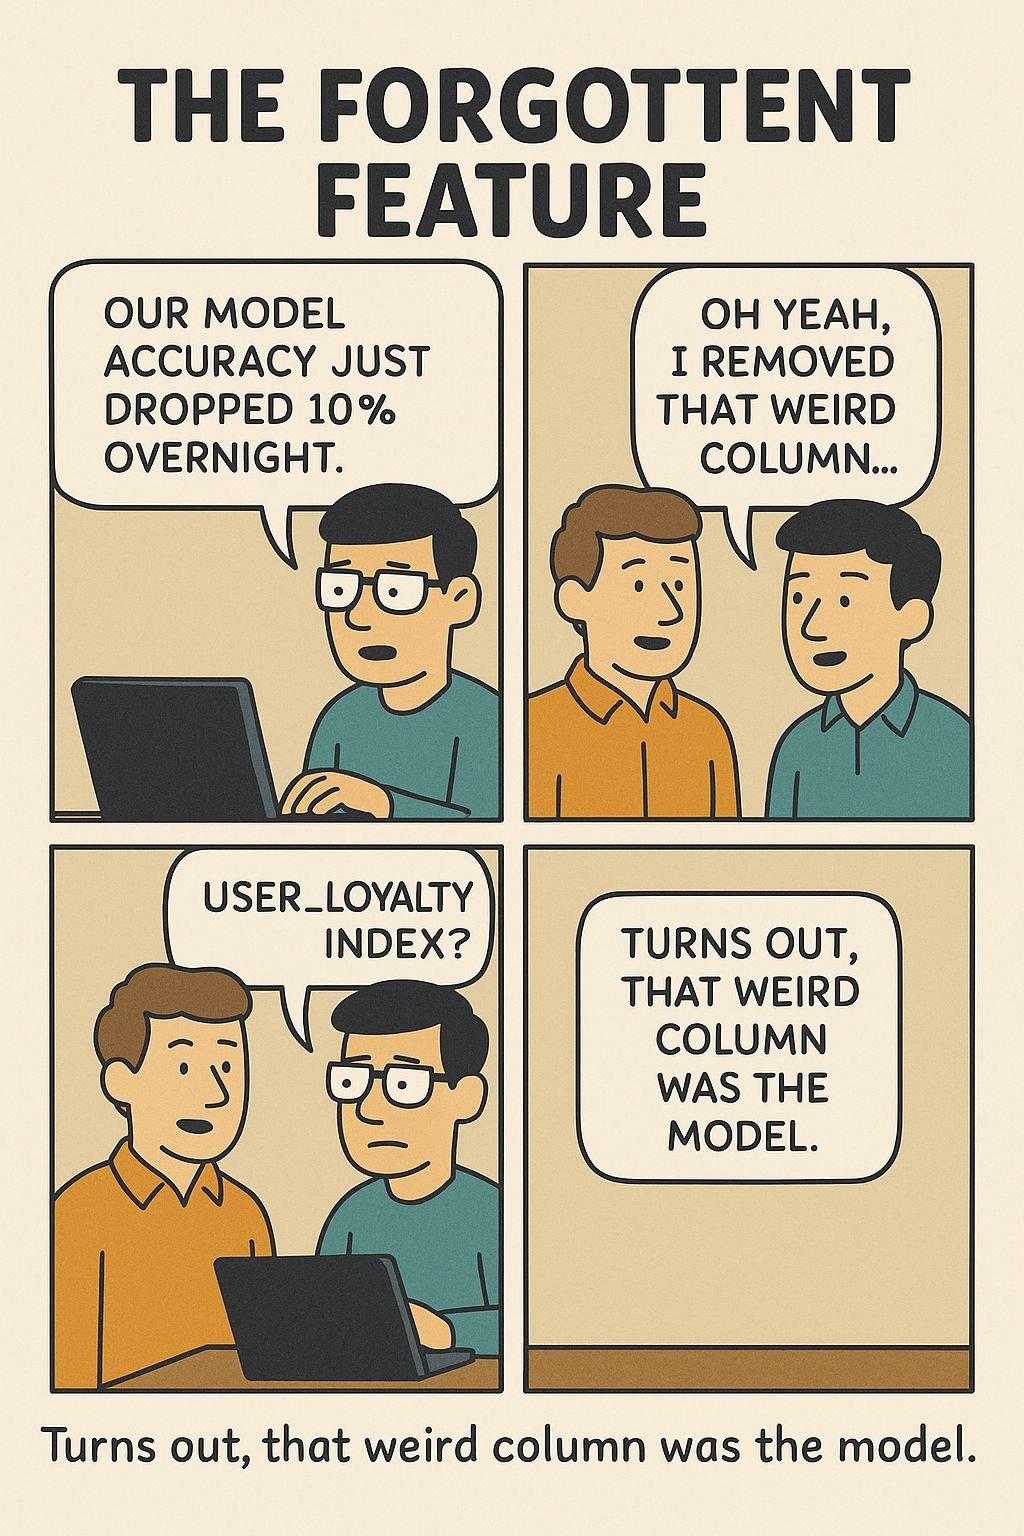
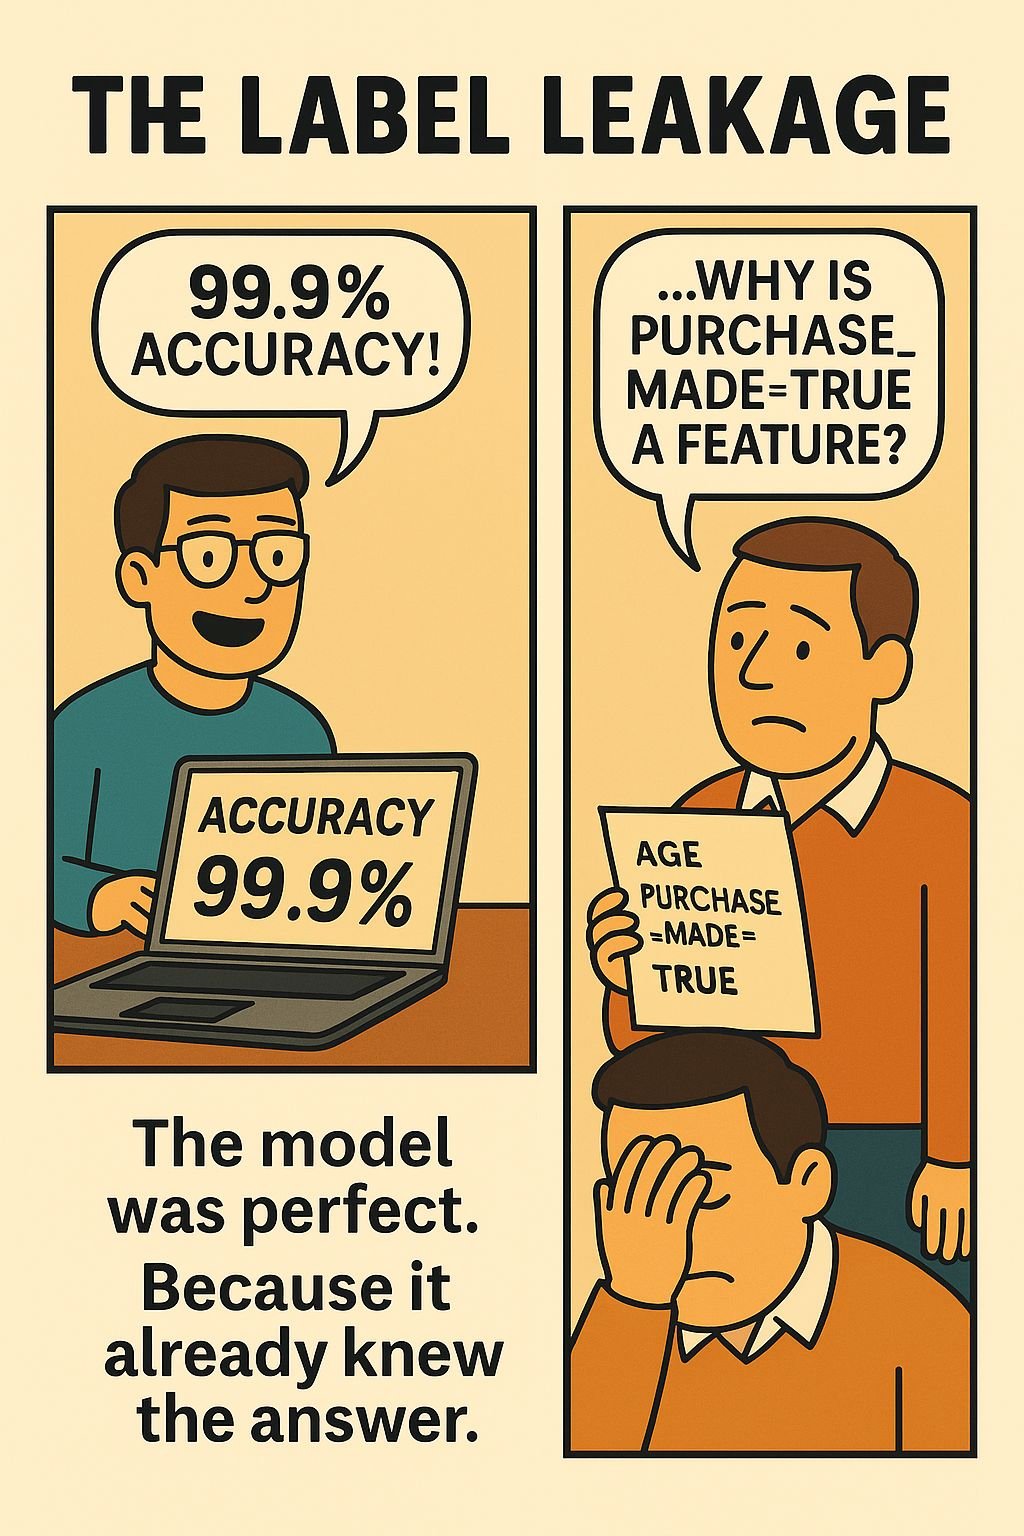
🧠 The Forgotten Feature
Model accuracy tanked overnight. Dev: “Oh… I removed user_loyalty_index.”
Turns out, that was the model.
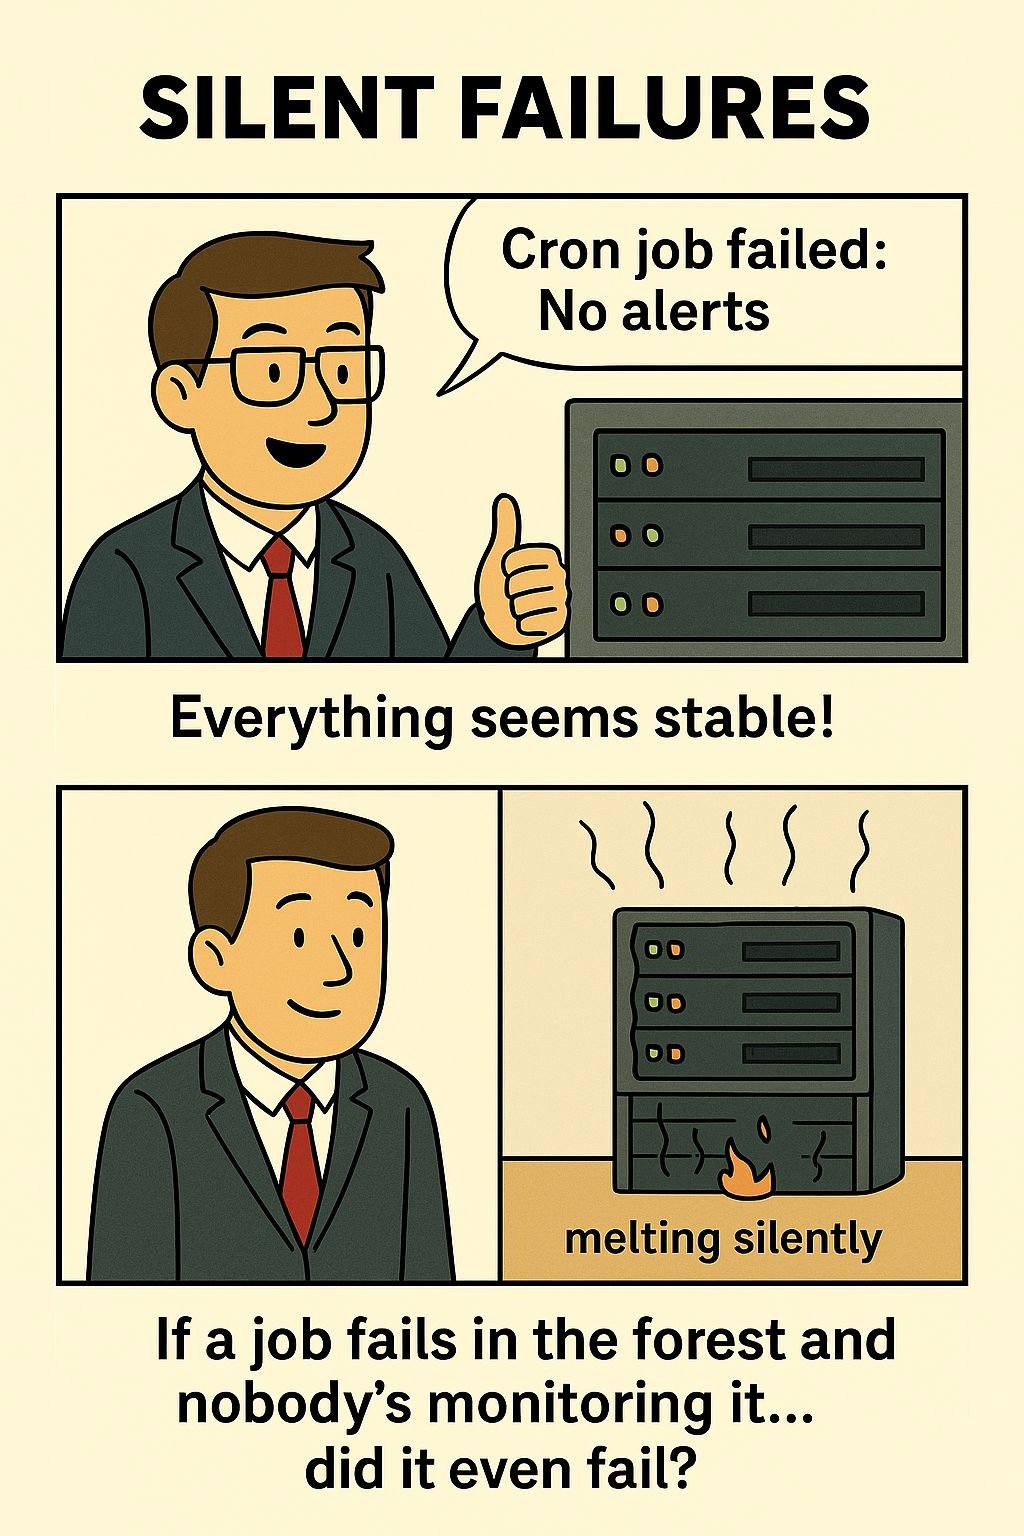
💻 Silent Failures
Cron job failed. No alerts. No logs.
Team Lead: “Everything seems stable!”
Meanwhile, systems are on fire. 🔥
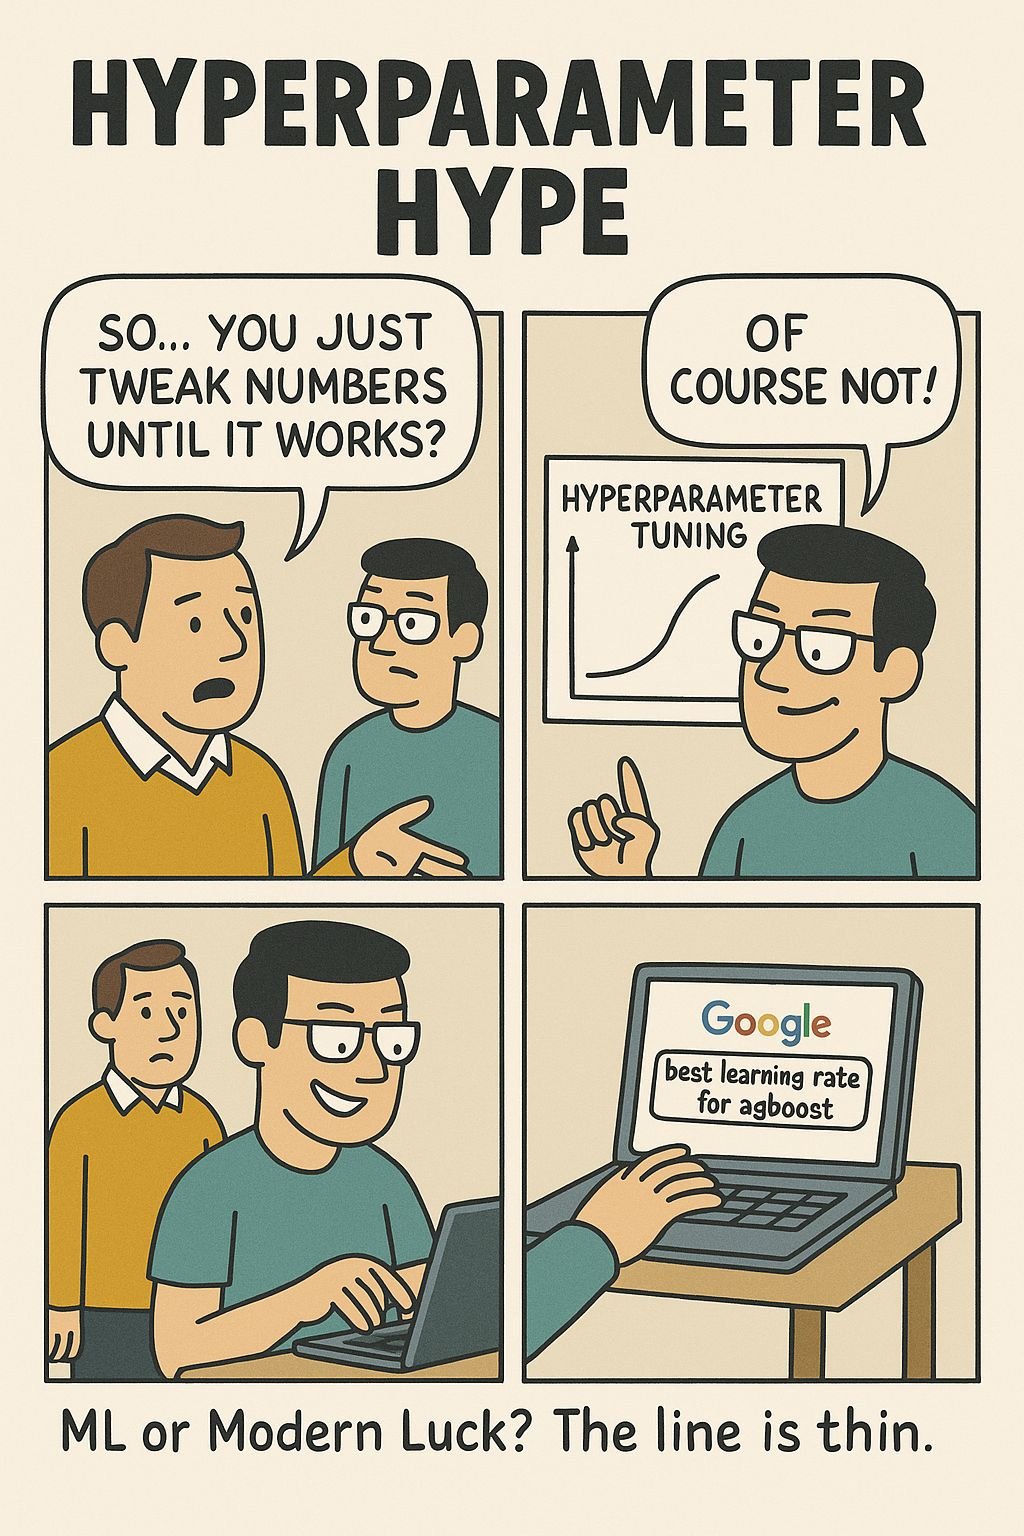
🧪 Hyperparameter Hype
Manager: “You tweak numbers?”
Data Scientist: “No... we Google which ones to tweak.”
Optimization is just fancy guessing. 🎯
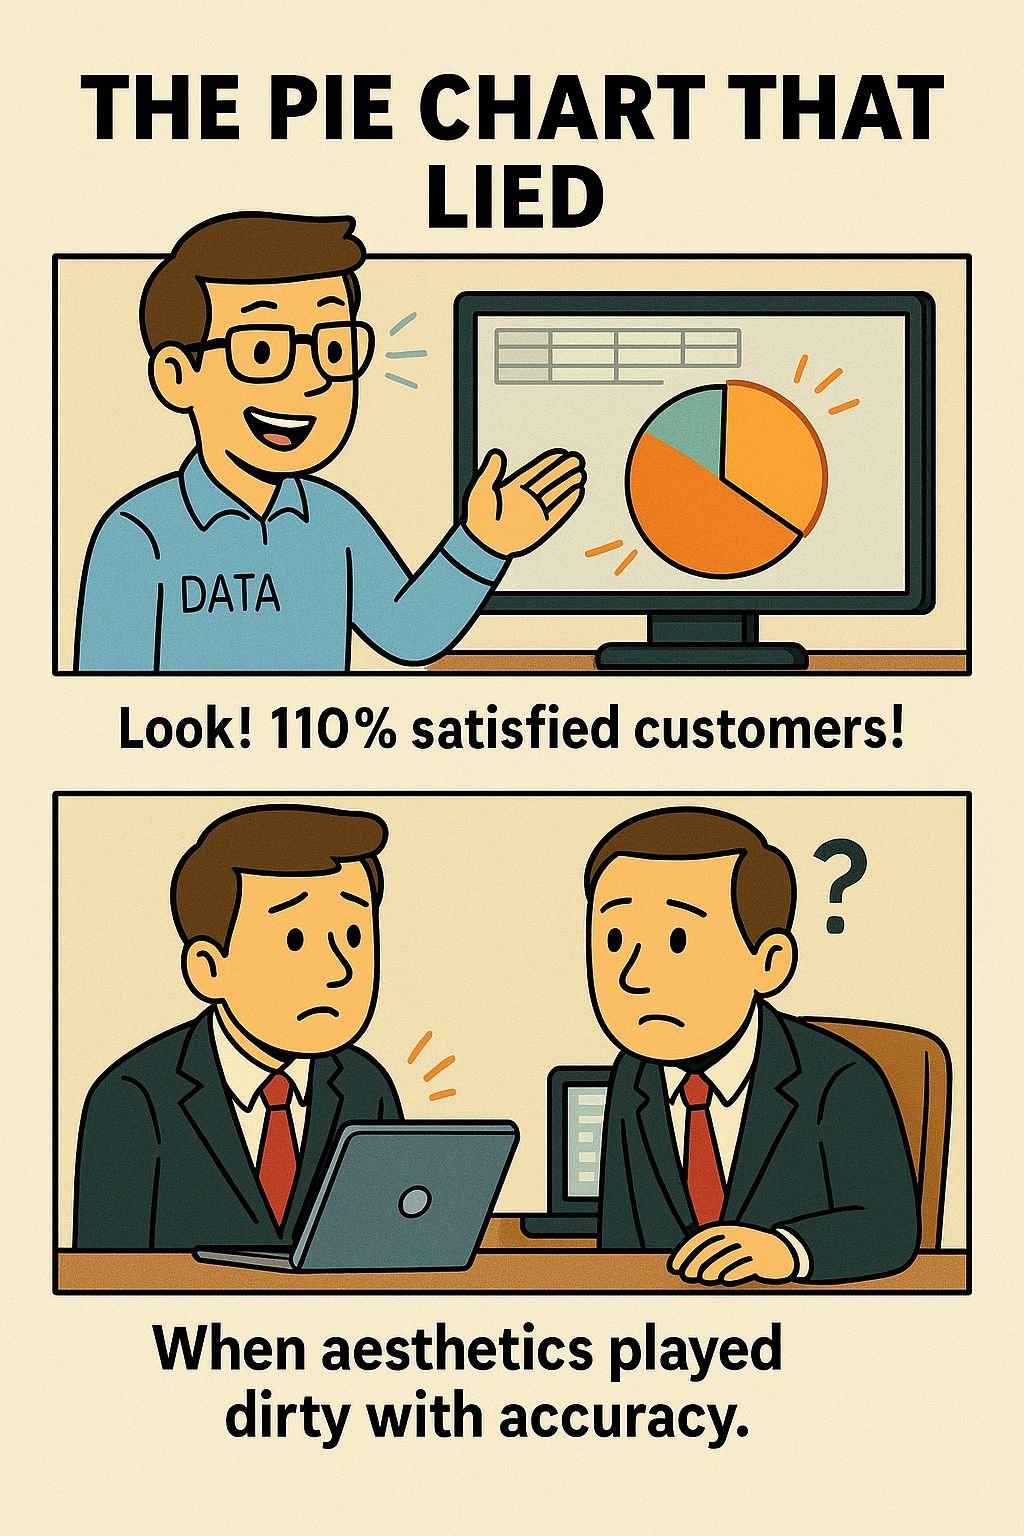
📊 The Pie Chart That Lied
Three segments. Each labeled 33%. Total? 110%.
Accuracy optional, aesthetics first. 🍕
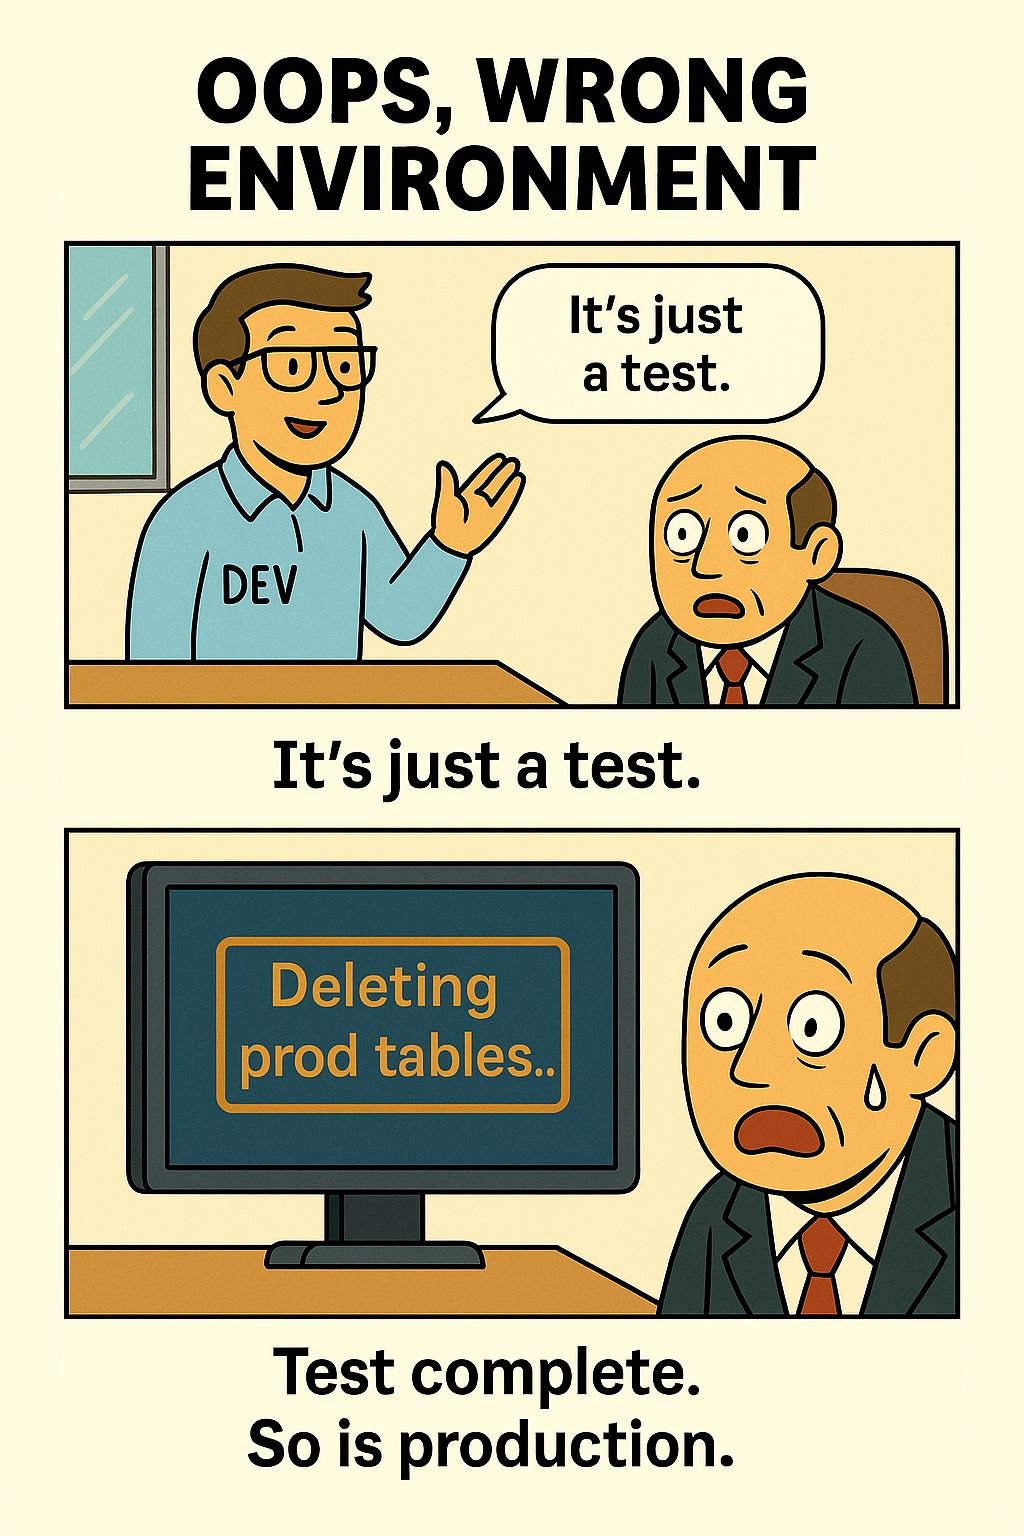
⚠️ Oops, Wrong Environment
Dev: “It’s just a test.”
Script: “Deleting prod tables…”
Test complete. So is production. 🧨

🧪 Version Control Chaos
File: final_v12_latest_REAL_final.py 🙃
The only true source of truth is chaos.
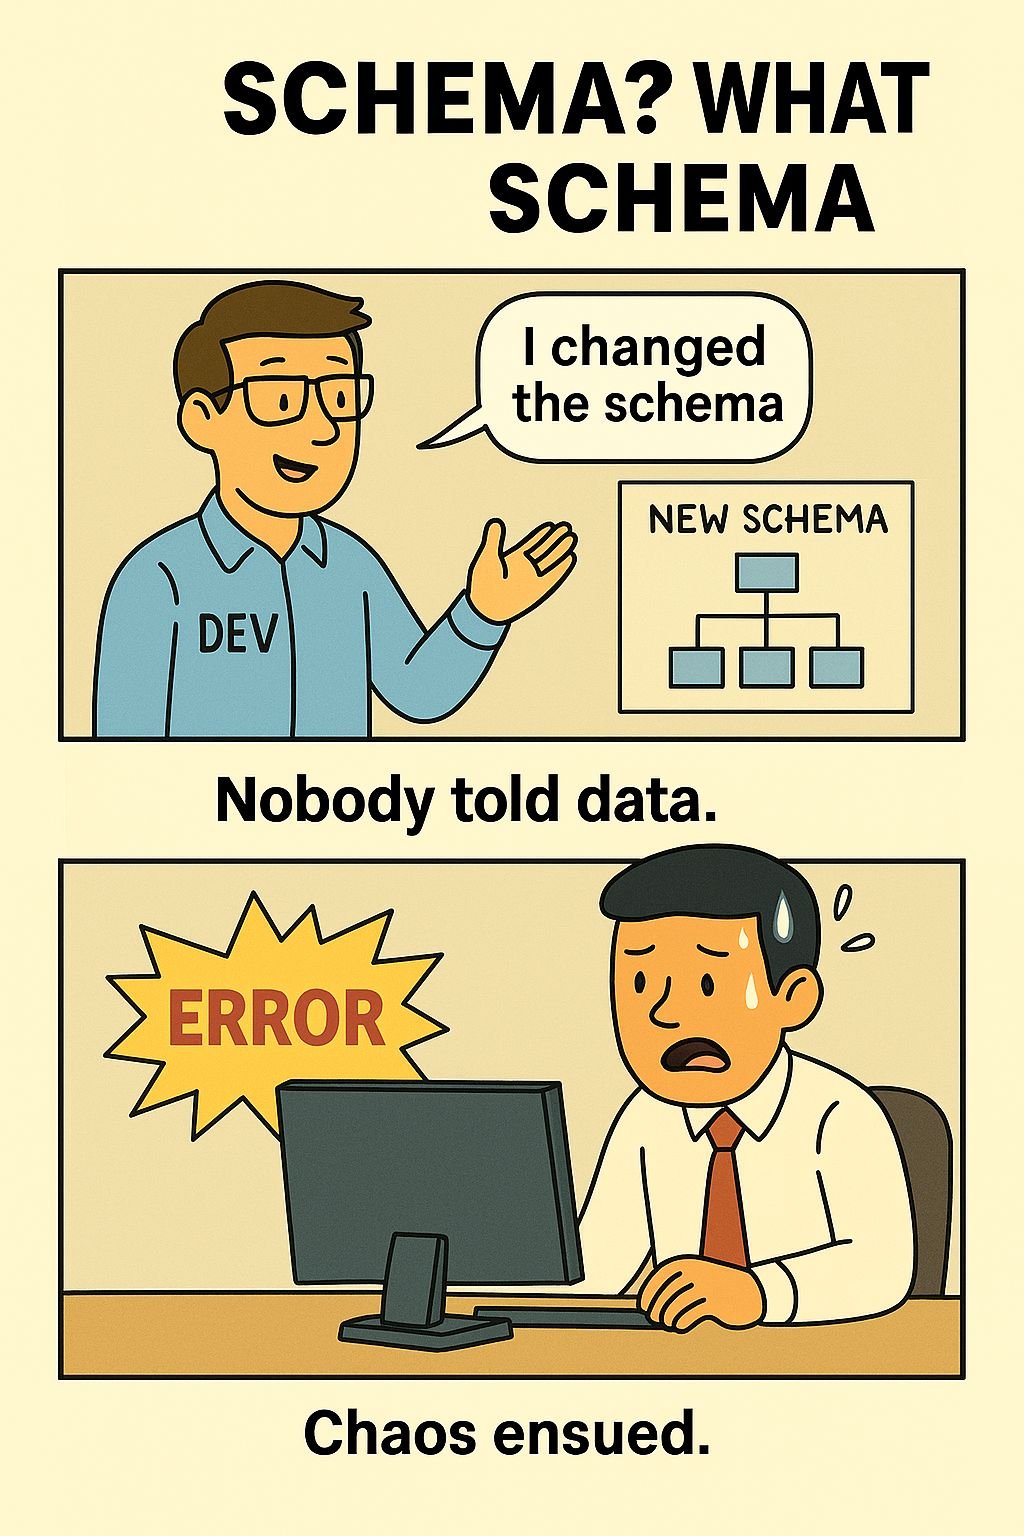
🧨 Schema? What Schema?
Dev changed the schema. Nobody told the data team.
Chaos ensued.
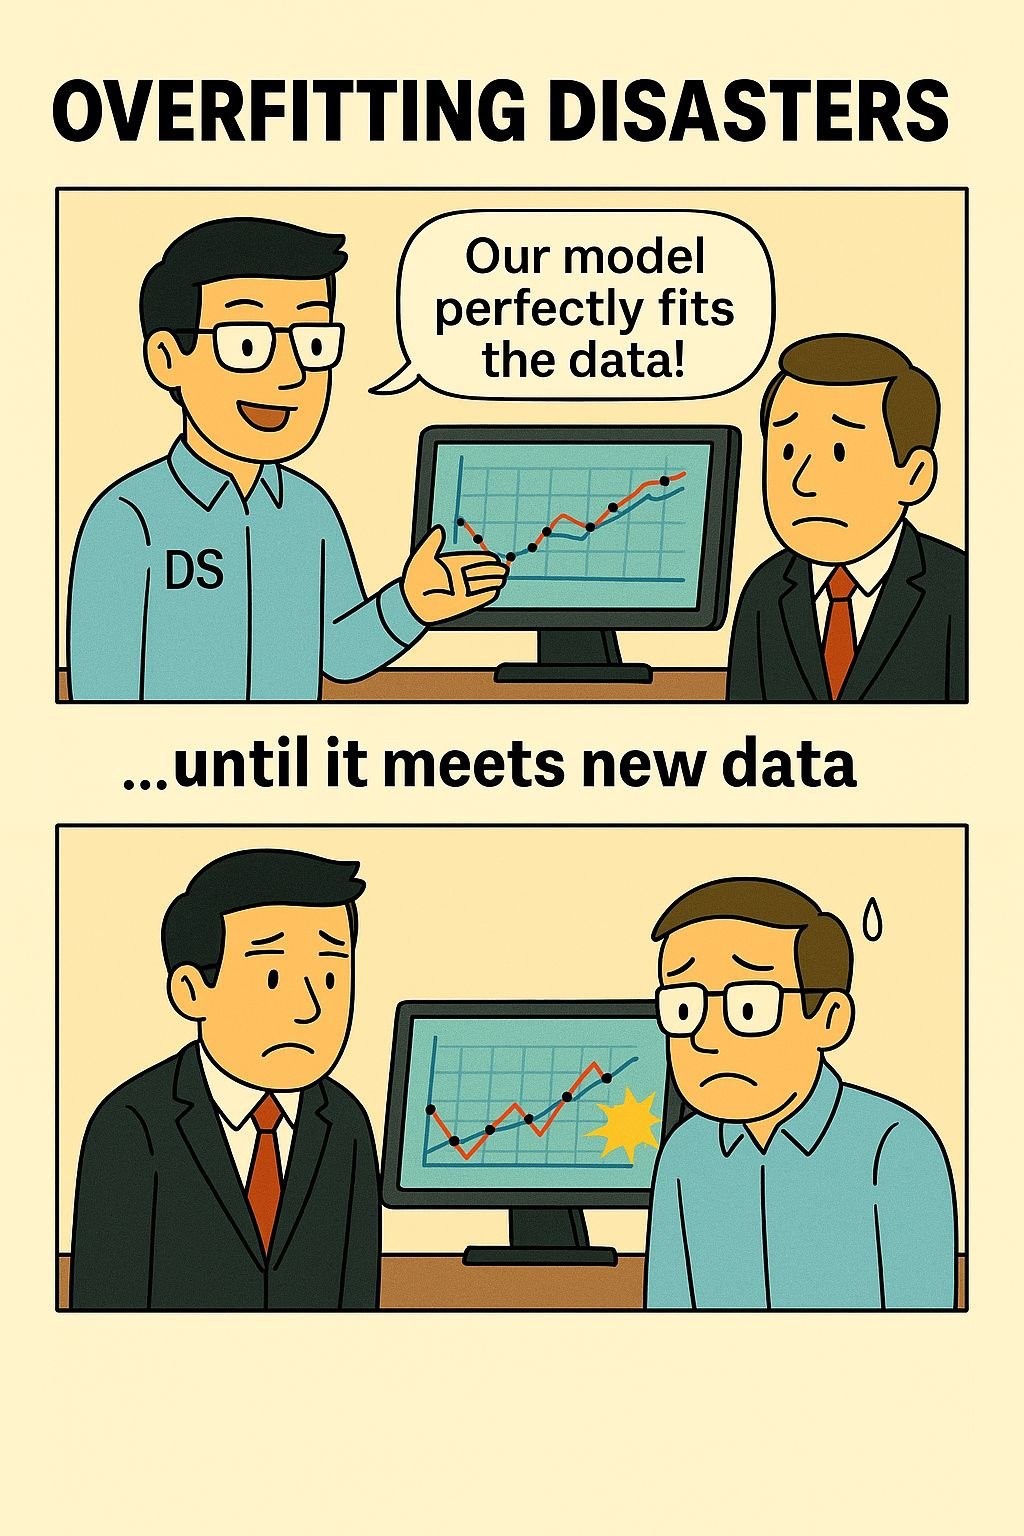
🎯 Overfitting Disasters
Model accuracy: 100%. Real-world accuracy: oops.
When overfitting strikes.
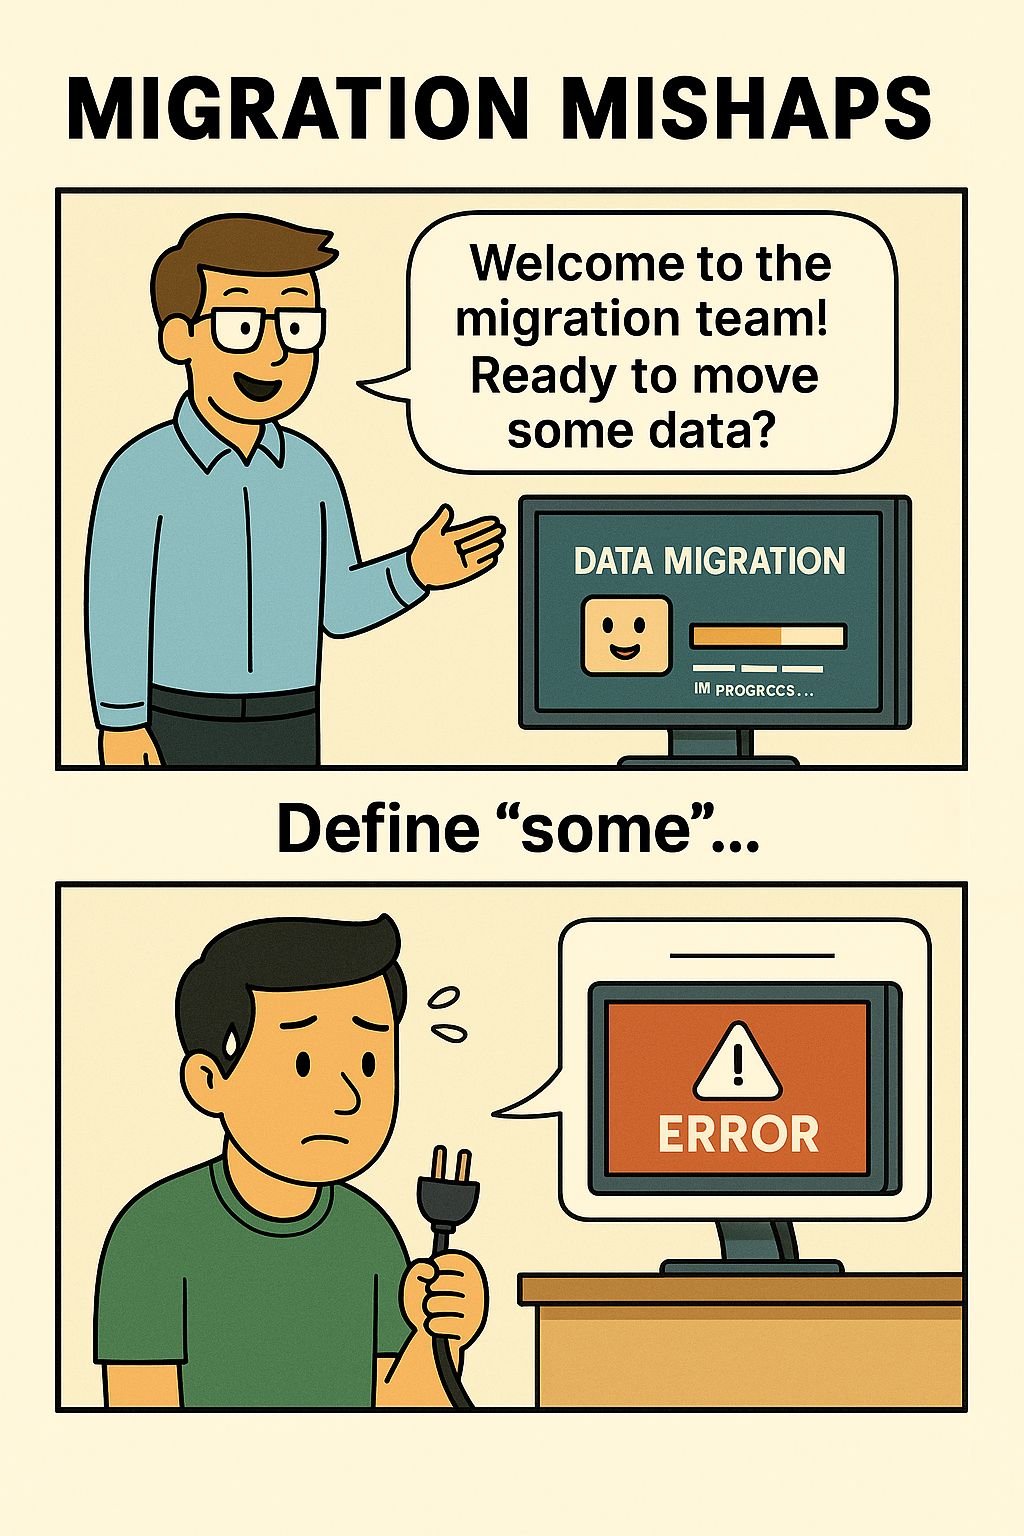
🌀 Migration Mishaps
“We migrated everything!” – “Why are all totals in Cyrillic?”
UTF-8 says hi.
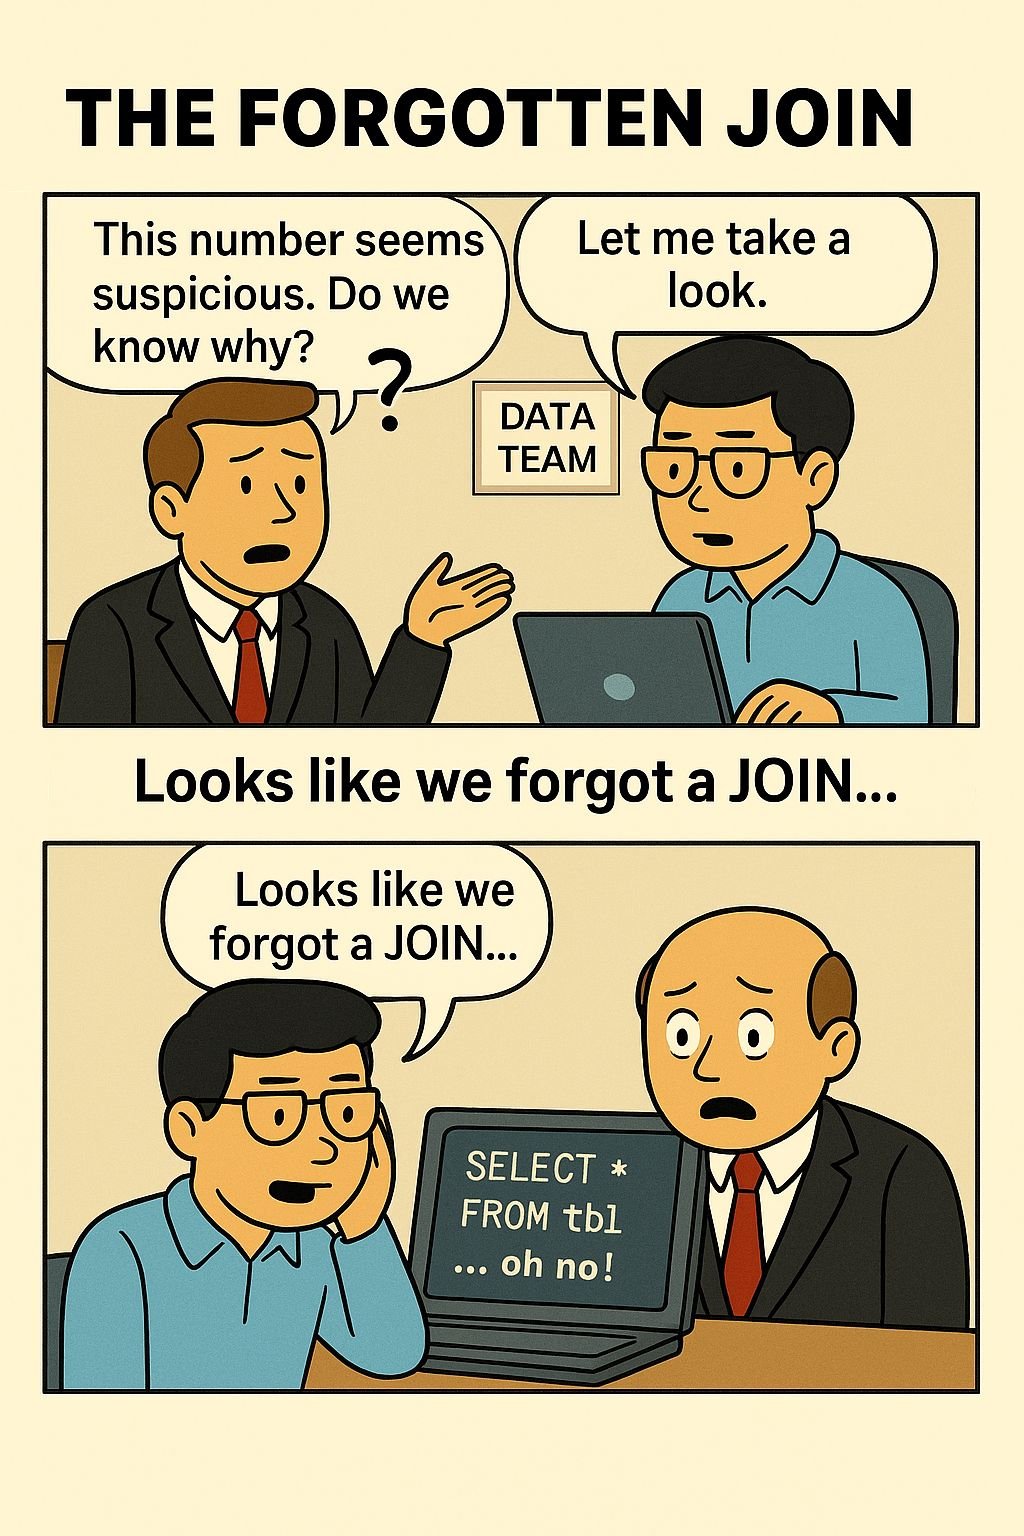
🔗 The Forgotten JOIN
Two tables walked into a query.
One never made it to the report.

🧪 The Legend of Production Data
He thought it was staging. Production thought otherwise.
Legends were born.

📉 Churn in Peace
Client: “Can we predict churn?”
Data Team: “Only if you give us behavior data.”
Client: “We’ve got names and numbers.” 🤷♂️
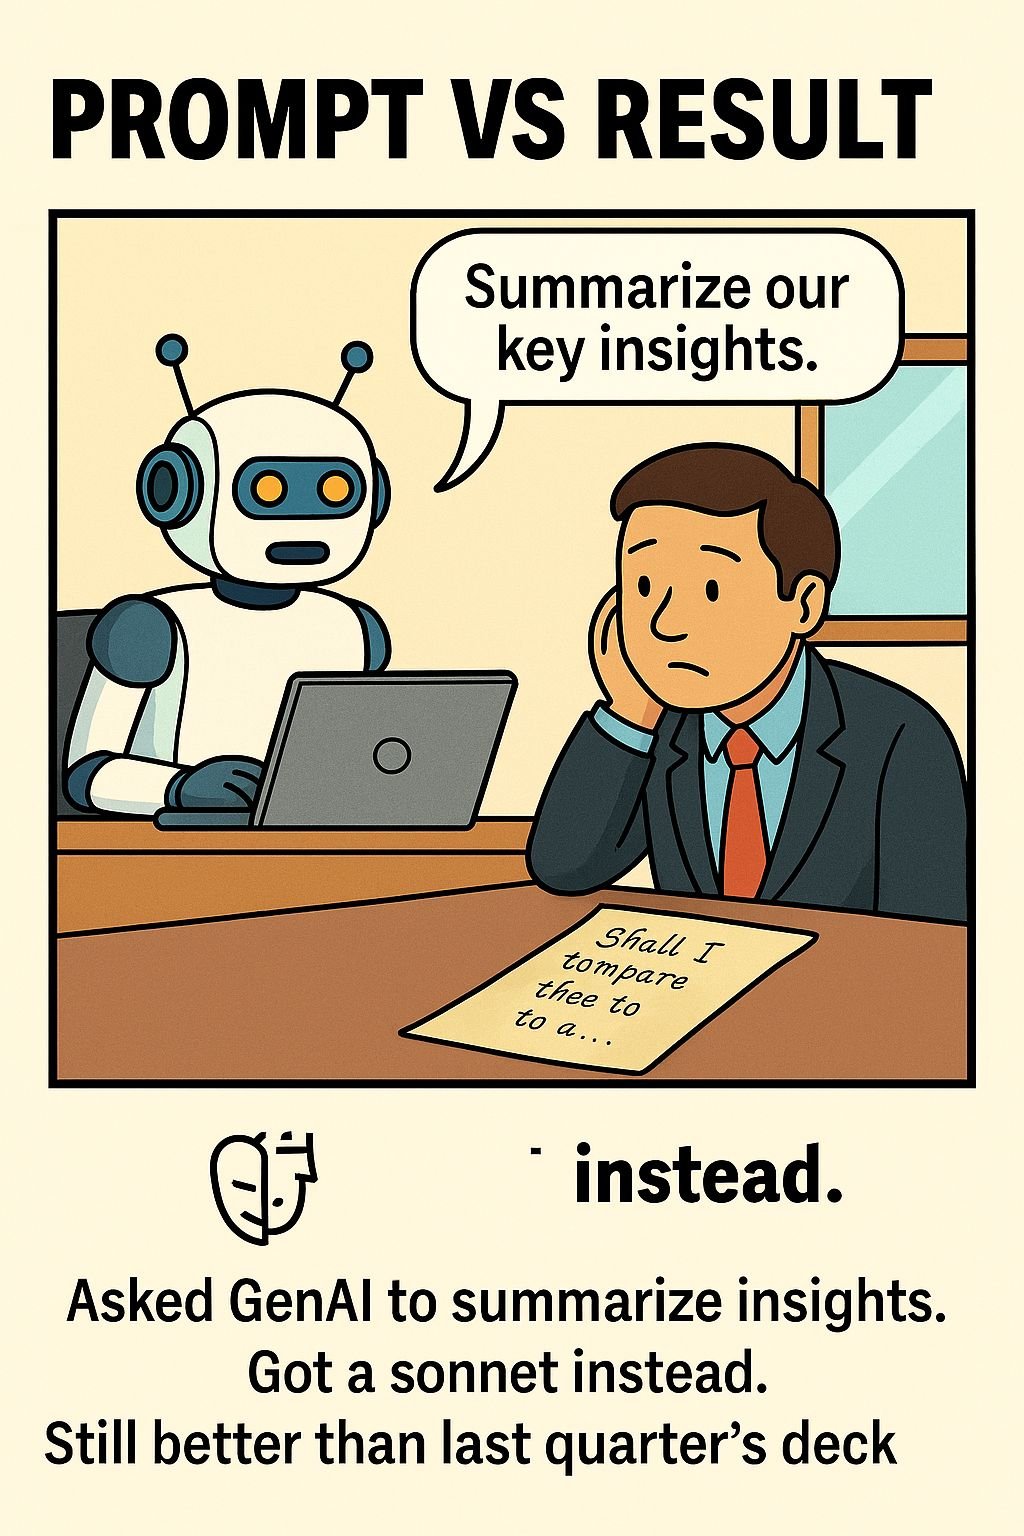
🎭 Prompt vs Result
Prompted GenAI for a data summary. It wrote a Shakespearean sonnet.
Still better than last quarter’s report. 📊
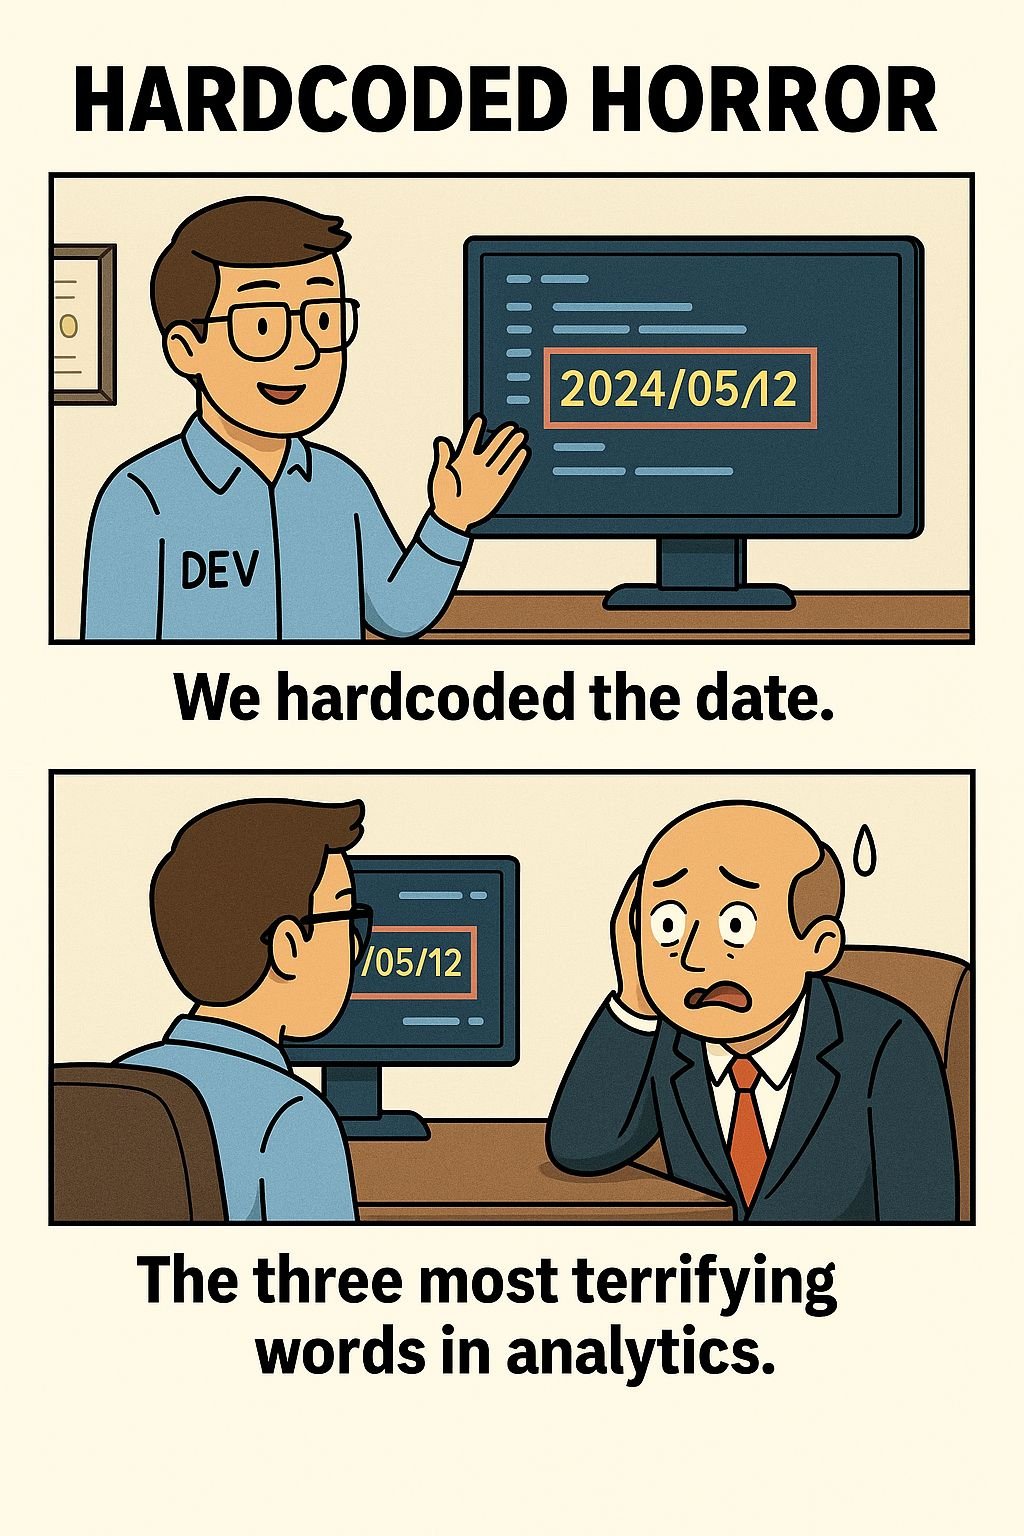
💻 Hardcoded Horror
"We hardcoded the date."
— The three most terrifying words in analytics.
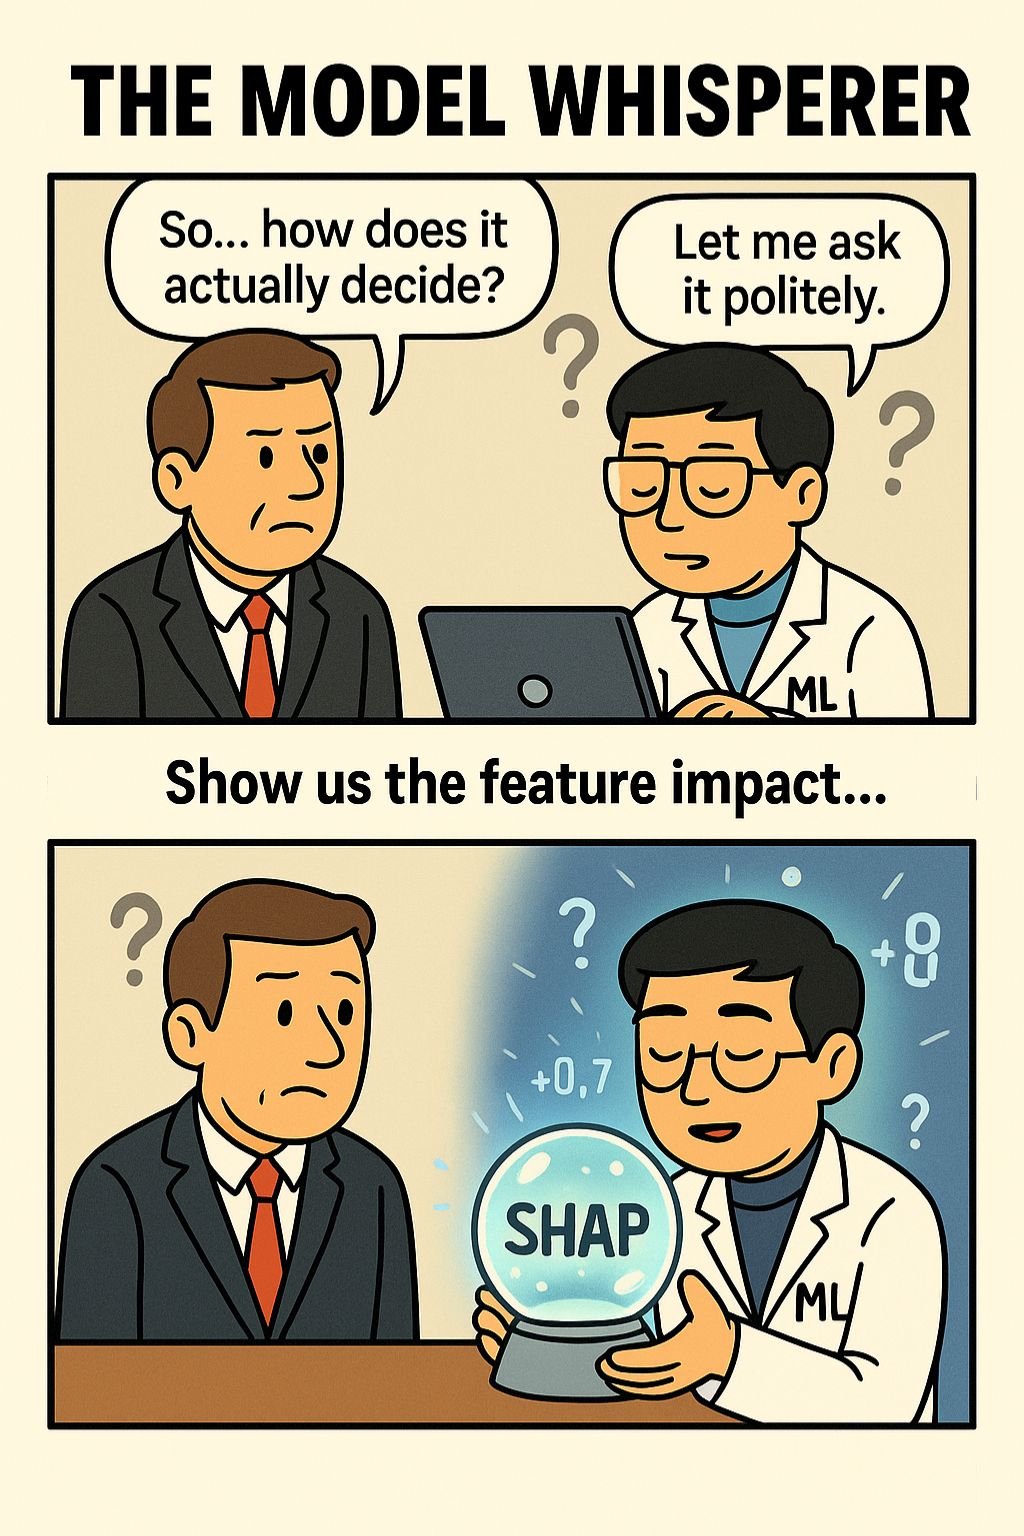
🔮 The Model Whisperer
“Let me ask the model politely…”
SHAP values: the crystal ball of modern data science.
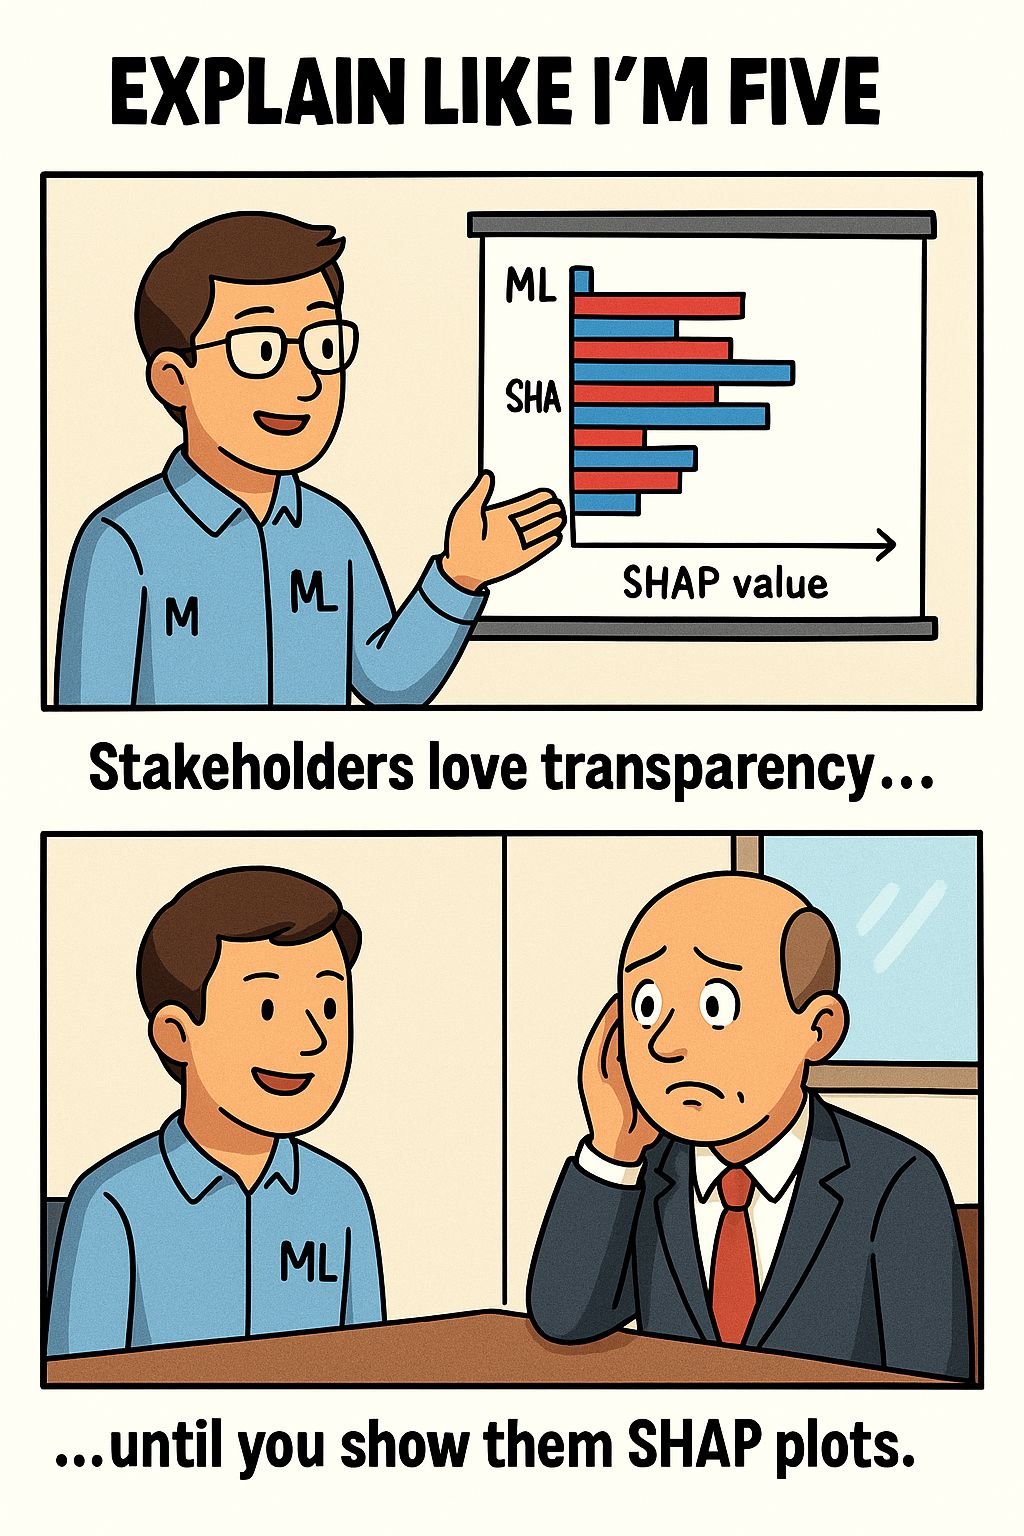
🧠 Explain Like I’m Five
Stakeholders love transparency…
Until you show them SHAP plots.
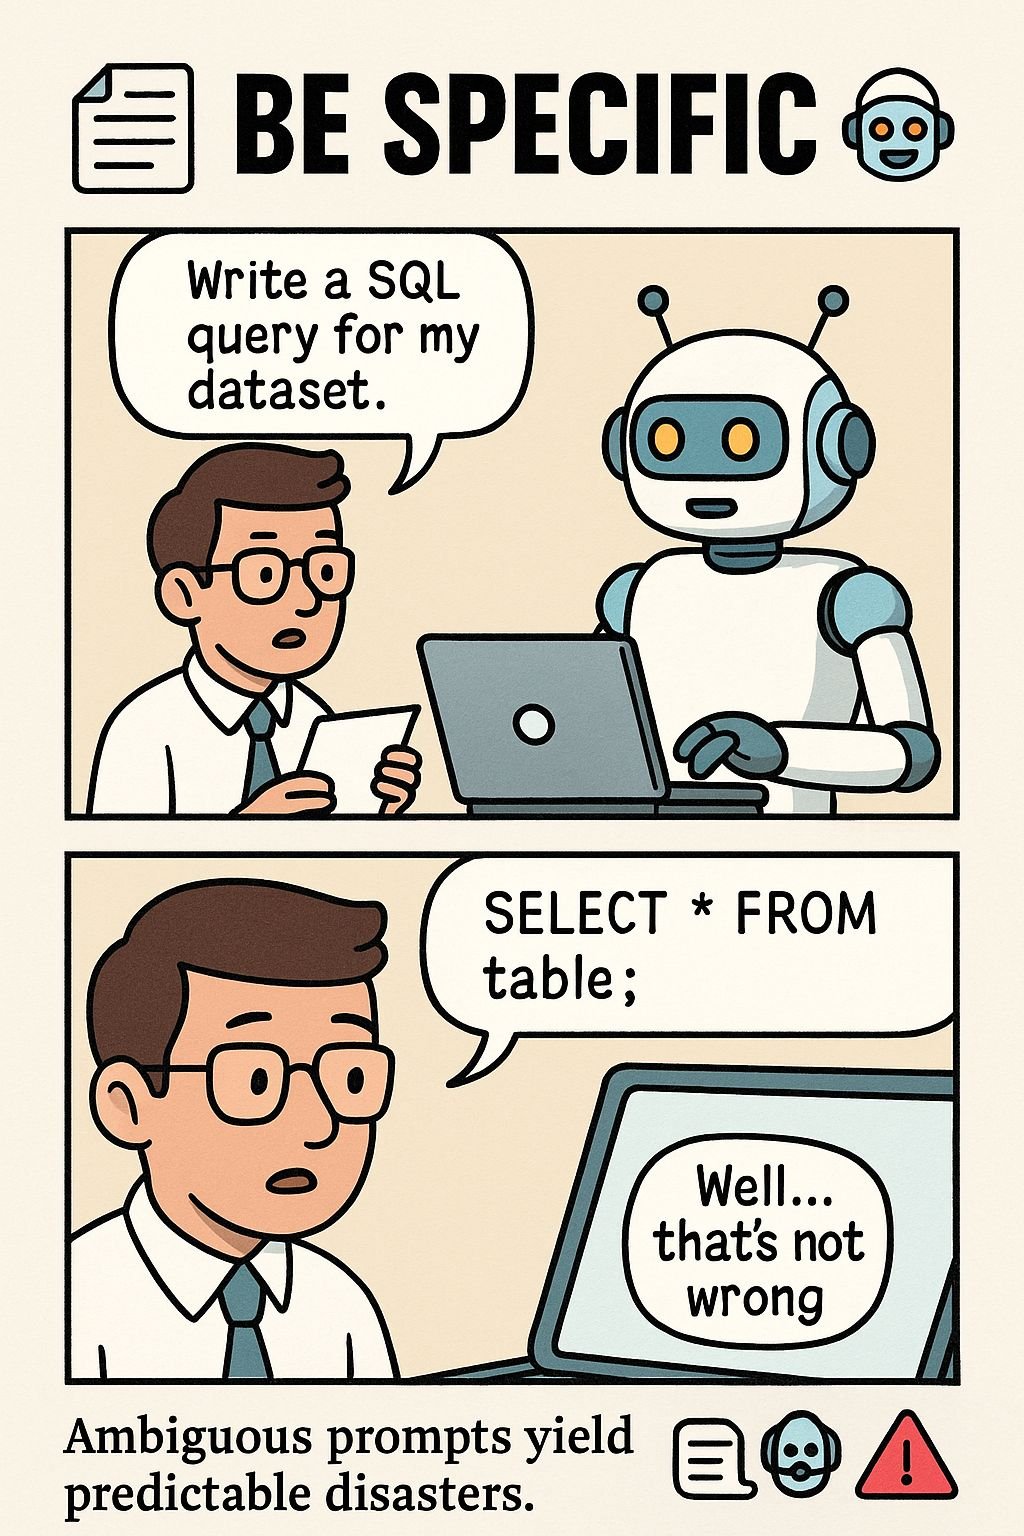
🤖 Be Specific
Prompt: "Give me a SQL query."
Result: SELECT * FROM table;
Ambiguity wins again!