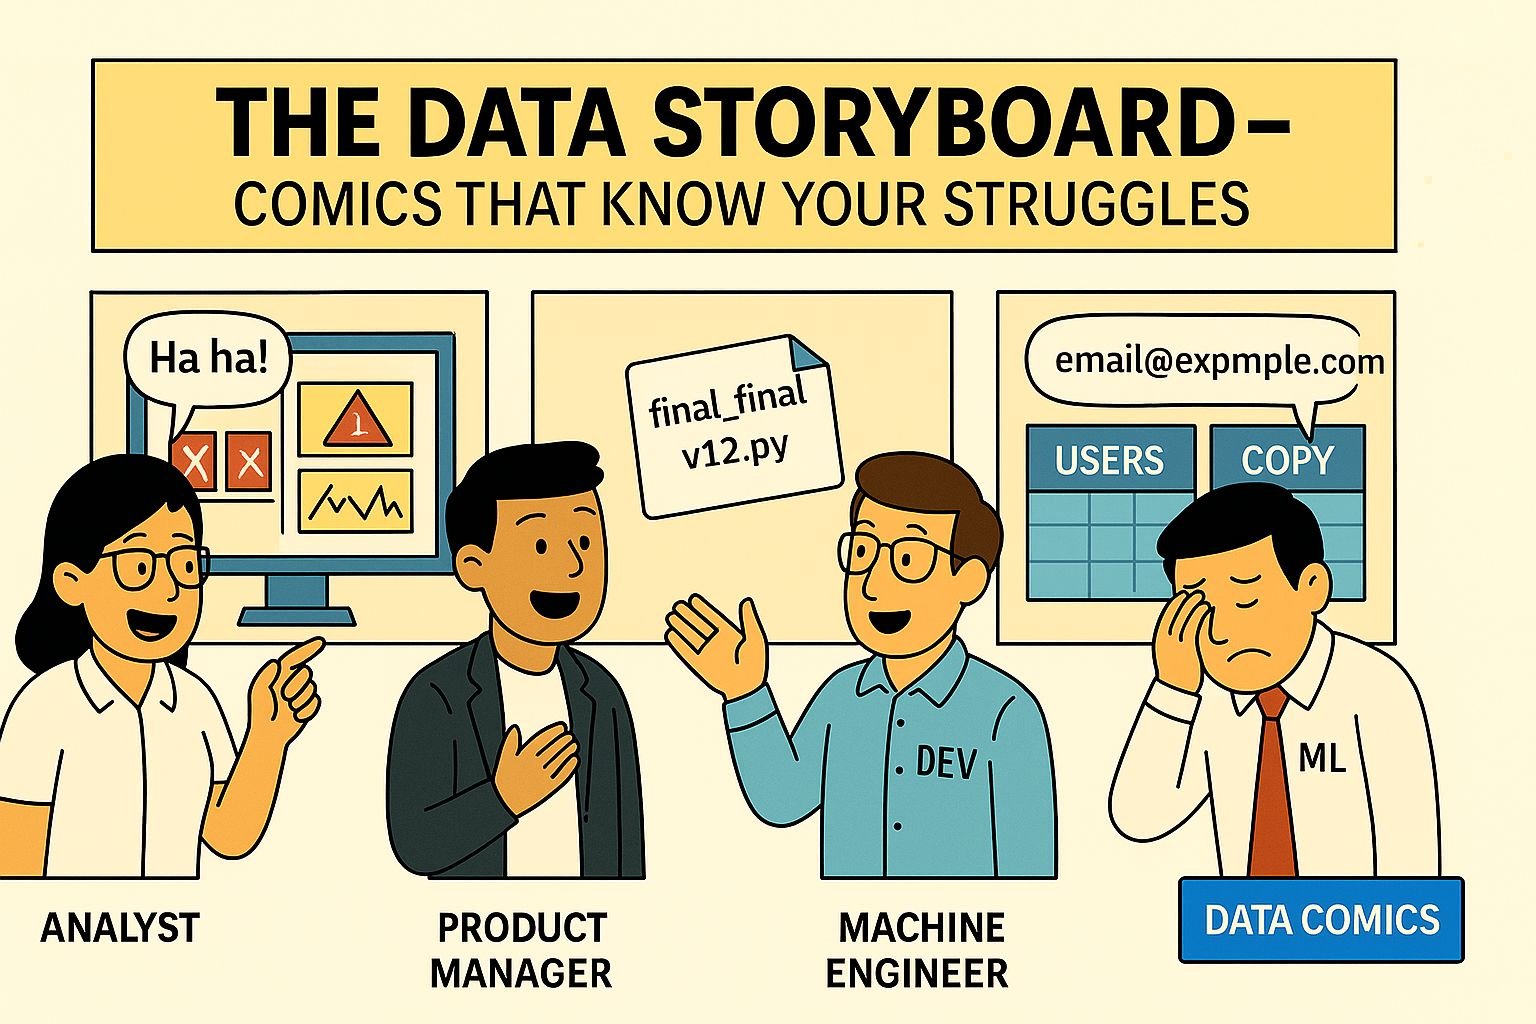
The Data Storyboard – Relatable Comics for Data Pros
Welcome to The Data Storyboard by DataComics — a comic strip series dedicated to the everyday challenges of data teams. If you’ve ever debugged at 2 a.m., this is for you.
🎖️ Operation Sindoor – Multi-Panel Visual Series
In Episode 10 of the India–Pakistan Conflict 2025 visual series, India turns the final page on its...
In Episode 9 of the India–Pakistan Conflict 2025 visual story, DAAVA compiles its final report—not...
In Episode 8 of the India–Pakistan Conflict 2025 visual story, the war stands at its most dangerous...
In Episode 7 of the India–Pakistan Conflict 2025 visual story, symbolism gives way to readiness...
In Episode 6 of the India–Pakistan Conflict 2025 visual story, the battlefield moves off the map and...
In Episode 5 of the India–Pakistan Conflict 2025 visual story, the loudest move was the one unheard...
India–Pakistan Conflict 2025 – 48 Hours, 0 Breach | Operation Sindoor Visual Narrative by DataComics
In Episode 4 of the India–Pakistan Conflict 2025 visual story, India’s air defense becomes the...
In Episode 3 of the India–Pakistan Conflict 2025 visual story, the battle moves beyond missiles—into...
In Episode 2 of the India–Pakistan Conflict 2025 visual story, India launches its first strike—not...
In Episode 1 of the India–Pakistan Conflict 2025 visual story, the war hasn’t started—but the...
🌌 The Illustrated Universe of DataComics
The analyst thought the dashboard spoke for itself. But no one saw Page 2. In this comic, we expose...
🌀 The Complete Collection – A Swipe Through Data Chaos
From hardcoded horrors to broken dashboards, this is where every comic comes together. Missed one? Dive into the chaos.

